
Figures & data
Figure 1. (a) TEM image of MCNTs; (b) HRTEM and SAED images of MCNTs; (c) XRD patterns of MCNTs, MNPs and CNTs; (d) TEM image of MNPs; (e) Raman spectra of MCNTs; (e) FTIR spectra of MCNTs and CNTs.
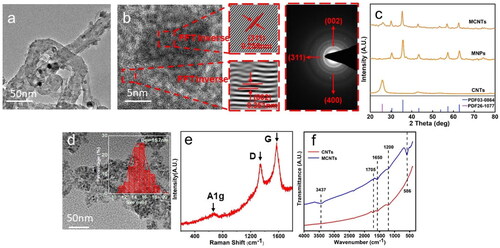
Figure 2. (a) Hysteresis loops of MCNTs and MNPs; (b) XPS Fe2p spectra of MNPs; (c) XPS Fe2p spectra of MCNTs; (d) TGA curves of MNPs; (e) TGA curves of MCNTs; (f) time dependent temperature curves of MCNTs at magnetic field intensity of 8 kA/m and 16 kA/m.
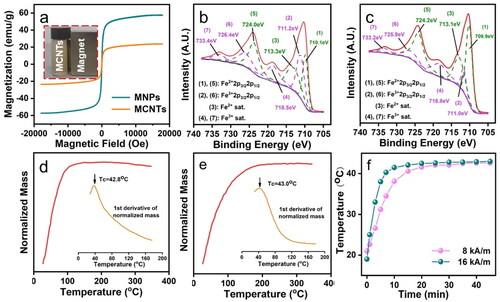
Figure 3. (a) DOX loading curves of MCNTs, ALG-MCNTs, CHI-MCNTs, ALG/CHI-MCNTs; (b) fitting curves of pseudo-second-order model; (c) Zeta potentials of MCNTs, ALG-MCNTs, CHI-MCNTs, ALG/CHI-MCNTs before and after loading DOX; (d) equilibrium DOX loading quantities against Zeta potentials.
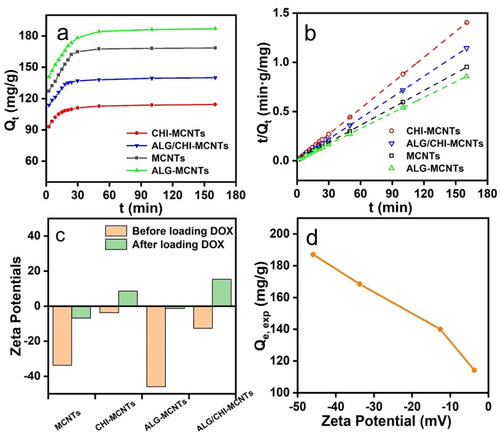
Table 1. Fitting parameters of pseudo-first-order and pseudo-second-order model for DOX loading curves of magnetic carbon nanotubes.
Figure 4. Cumulative release curves of DOX with pH at 4.00 (a) and 6.86 (b). error bars were calculated ± SD of three repetitions.
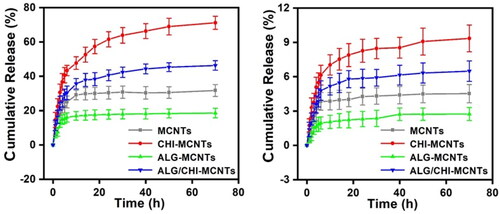
Figure 5. Temperature curves and DOX cumulative release curves of magnetic carbon nanotubes under alternating magnetic field (MCNTs: a, b; CHI-MCNTs: c, d; ALG-MCNTs: e, f; ALG/CHI-MCNTs: g, h). among them, a, c, e and g are temperature curves and DOX cumulative release curves in 70 h; b, d, f and h are temperature curves and DOX cumulative release curves in 5 h.
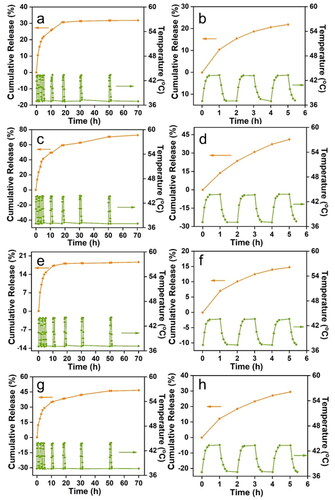
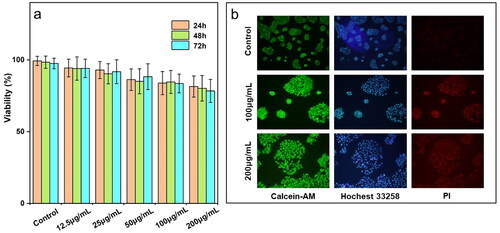
Figure 6. (a) Cell viability evaluated using the CCK-8 assay following co-culture with MCNTs for 24, 48, and 72 h; (b) fluorescence images of HaCaT cells captured after 72 h of co-culture with MCNTs, showing staining with Calcein-AM (green), PI (red), and Hoechst 33258 (blue).
Supplemental Material
Download MS Word (388.2 KB)Data availability statement
The data used for the current study are available from the corresponding author upon reasonable request.