
Figures & data
Table 1. Overview of the AMF frequencies generated by the magneTherm™ Digital and the corresponding measured maximum magnetic field peak strengths including standard deviation (n = 3).
Figure 1. Schematic drawing of the insulated polystyrene sample holder (grey) containing the plastic sample vial (blue) and two glass fiber thermometers.
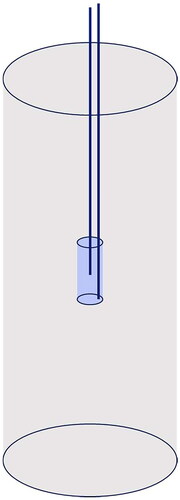
Table 2. Overview of MNPs evaluated in this study and their corresponding magnetic properties [Citation21].
Figure 2. Heating/cooling curve of HyperMag-C sample in the insulated sample holder. The solid and the dashed lines represent the core and the bottom temperatures of the sample, respectively.
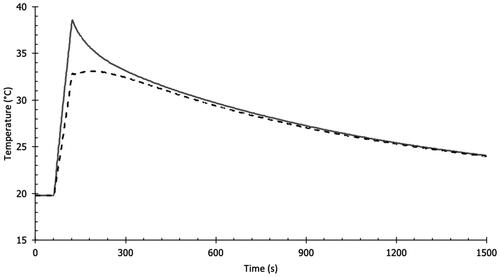
Figure 3. Heating curves of an old, unstable batch of HyperMag-C MNPs obtained with two thermometers placed at the center (solid line) and the bottom (dashed line) of the sample measured immediately after (A) or a few hours after (B) rigorous stirring.
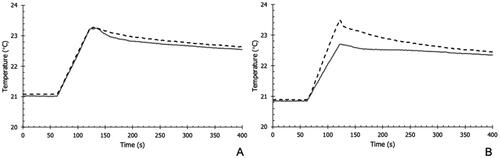
Figure 4. The SLP of all synthesized Pd/Fe-oxide-n MNPs vs their size (n) measured at 50, 346 and 730 kHz. Commercial nanoparticles (Fe-oxide-comm, HyperMag-C) with the size of 15 nm are also included for comparison.
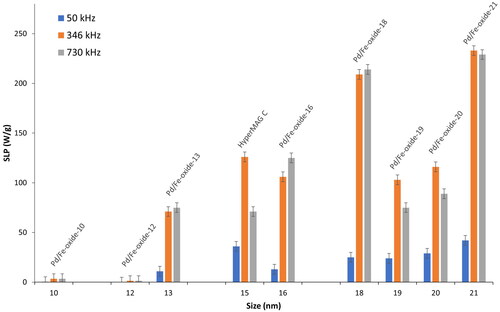
Figure 5. Magnetization curves measured with dry Pd/Fe-oxide MNPs at 300 K (A) as described in [Citation21] and magnification of the x-axis showing coercivities Hc at static field.
![Figure 5. Magnetization curves measured with dry Pd/Fe-oxide MNPs at 300 K (A) as described in [Citation21] and magnification of the x-axis showing coercivities Hc at static field.](/cms/asset/7c24c4f0-3fde-4406-bcbe-13817925aec9/ihyt_a_2299480_f0005_c.jpg)
Figure 6. Blocking temperatures of the Pd/Fe-oxide-n MNPs [Citation21] vs their SLP at 50, 346 and 730 kHz.
![Figure 6. Blocking temperatures of the Pd/Fe-oxide-n MNPs [Citation21] vs their SLP at 50, 346 and 730 kHz.](/cms/asset/d79bea23-d447-45e5-9a1b-66e01de09f97/ihyt_a_2299480_f0006_c.jpg)
Figure 7. Modeled relationship between SLP and tumor radius, and the achievable temperature increase within the tumor with homogeneously distributed MNPs. The lines represent the actual SLP values of Pd/Fe-oxide-21 (A), Pd/Fe-oxide-18 (B) and Pd/Fe-oxide-20 (C) measured at the optimal field (19 mT) and frequency (345 kHz) combination.
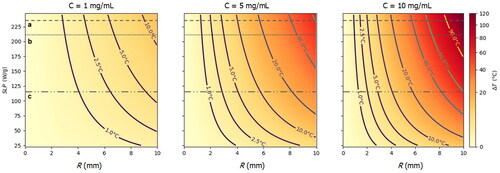
Table 3. The Pd/Fe-oxide-n MNP batches and corresponding SLP measured at 346 kHz. For each sample the minimum tumor radius Rmin that can be thermally ablated (ΔT = 15 °C) is calculated using EquationEq. (5)(5)
(5) , any tumor with a radius larger than Rmin can be thermally ablated. The shaded samples have the highest SLP and are therefore most suitable for thermal ablation.
Supplementary Material
Download PDF (728.3 KB)Data availability statement
The data underlying this work is available upon request from the corresponding author.