
Figures & data
Figure 1. Research flowchart. RFA, radiofrequency ablation.
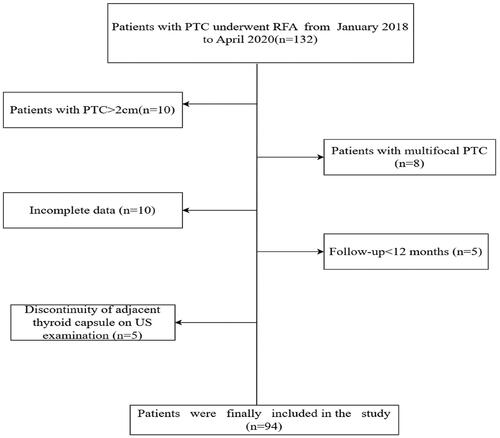
Figure 2. A schematic diagram illustrating the location of the nodules abutted to the capsule.
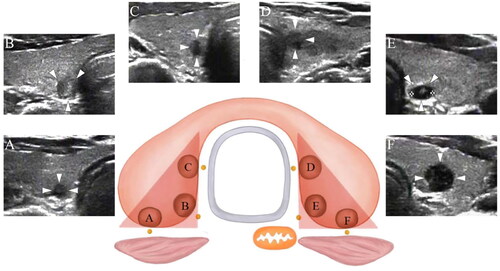
Figure 3. Electrode in vitro test thermal field maps and sufficient tracheal-paratracheal fluid isolation demonstration.
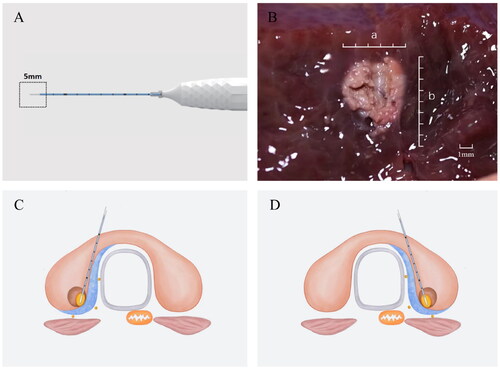
Figure 4. A 46-year-old woman with papillary thyroid cancer in the ‘danger triangle’ of the thyroid was treated with radiofrequency ablation (RFA).
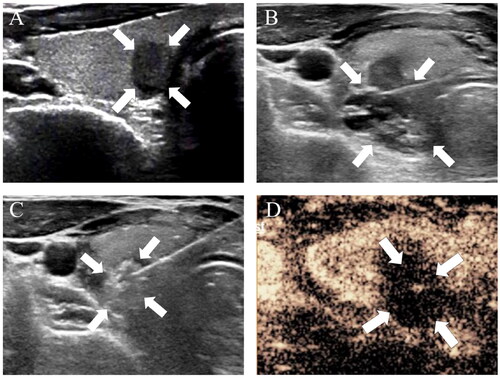
Table 1. Demographic characteristics of patients with PTC in the danger triangle area.
Figure 5. Graph shows Kaplan-Meier curves for tumor disappearance rate in T1a and T1b groups.
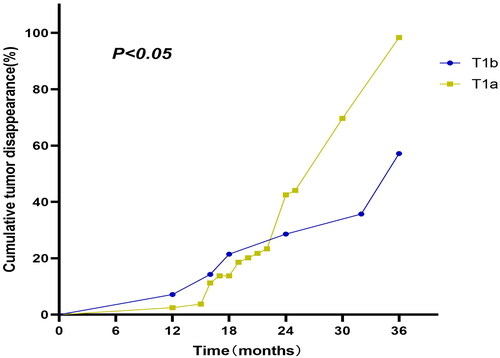
Figure 6. Change in mean volume and volume reduction rate (VRR) at each follow-up time point.
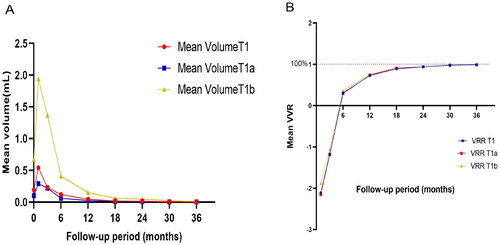
Table 2. Indicators of thyroid function before RFA and after RFA.
Table 3. Tumor size before RFA and at each follow-up time-point after RFA.
Data availability statement
The datasets used and/or analyzed in the current study are available from the corresponding author upon reasonable request. Please contact the corresponding author ([email protected]).