
Figures & data
Figure 1. Cytotoxicity of hyperthermia and 5-Fu in AGS and SNU-1 gastric cancer cells. (A) Experimental design. AGS and SNU-1 cells were treated with or without 5-Fu at 37 or 43 °C for 1 h, followed by incubation at 37 °C for 23 h. (B) Vehicle or 5-Fu (25 μM) was treated at 37 or 43 °C. Cell morphology was inspected under a 4× objective lens. (C–H) Cells were treated with or without increasing dose of 5-Fu at 37 or 43 °C. Apoptosis was detected by annexin V/PI double staining, PARP cleavage and caspase-3 activation. *: p < 0.05 compared to 0 μM 5-Fu at 37 °C. @: p < 0.05 compared to 0 μM 5-Fu at 43 °C. #: p < 0.05; significant difference between indicated dose of 5-Fu at 37 and 43 °C.
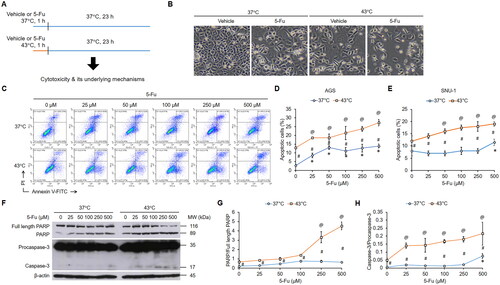
Figure 2. Cell regrowth after hyperthermia and 5-Fu treatment. (A) Experimental design. Cells were treated with or without 5-Fu at 37 or 43 °C for 1 h, followed by incubation at 37 °C for 23 h. Dead cells (suspended cells) were washed away. Attached cells were collected and re-seeded onto new six-well plates. (B) Cell regrowth was monitored by colony formation assay. Yellow arrows indicate colonies.
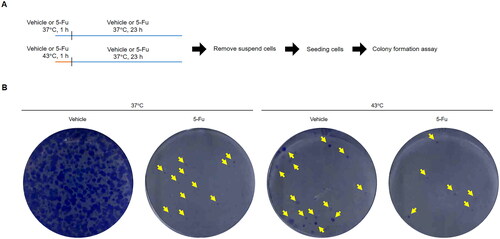
Figure 3. Effects of hyperthermia and 5-Fu on survival signals. (A–F) Cells were treated with or without increasing doses of 5-Fu at 37 or 43 °C for 1 h, followed by incubation at 37 °C for 23 h. Levels of phospho-STAT3 (Tyr705), STAT3, phospho-Akt (Ser473), Akt, phospho-ERK1/2 (Thr202/Tyr204), ERK1/2 and β-actin were measured by western blotting. Band intensities were quantified using ImageJ. *: p < 0.05 compared to 0 μM 5-Fu at 37 °C. p < 0.05: significant difference between indicated dose of 5-Fu at 37 and 43 °C. (G,H) Cells were pretreated with Stattic (5 μM) for 1 h, followed by 5-Fu (25 μM) at 37 °C for 23 h. Apoptosis was detected by PARP cleavage and annexin V/PI double staining. Cells were pretreated with GDC-0068 (100 nM) for 1 h, followed by 5-Fu (25 μM) at 37 °C for 23 h. (I,J) Apoptosis was detected by PARP cleavage and annexin V/PI double staining. (K,L) Cells were pretreated with U0126 (10 μM) for 1 h, followed by 5-Fu (25 μM) at 37 °C for 23 h. Apoptosis was detected by PARP cleavage and annexin V/PI double staining. *: p < 0.05: significance between indicated groups. Veh: vehicle; 5 + S: 5-Fu + Stattic; 5 + G: 5-Fu + GDC-0068; 5 + U: 5-Fu + U0126; Sta: Stattic; GDC: GDC-0068; U0: U0126.
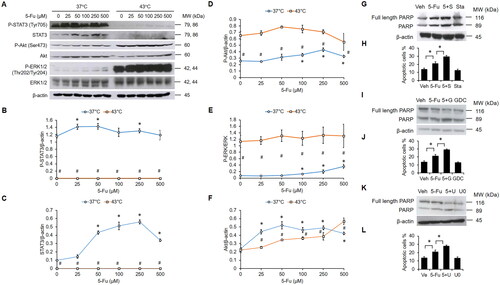
Figure 4. Effects of hyperthermia and 5-Fu on chemoresistance-related proteins and oxidative status. (A–C) Cells were treated with or without increasing doses of 5-Fu at 37 or 43 °C for 1 h, followed by incubation at 37 °C for 23 h. Levels of MDR1 and thymidylate synthase were measured by western blotting. *: p < 0.05 compared to 0 μM 5-Fu at 37 °C. @: p < 0.05 compared to 0 μM 5-Fu at 43 °C. #: p < 0.05; significant difference between indicated dose of 5-Fu at 37 and 43 °C. (D) Oxidative stress was measured by DCF-DA flow cytometry. Numbers show percent positive cells. (E–H) Cells were treated with or without 5-Fu (25 μM) at 37 or 43 °C for 1 h, then incubated at 37 °C for 23 h. Levels of catalase, SOD1 and SOD2 were measured by western blotting. Quantification of band intensities was performed using ImageJ. *: p < 0.05: significance between indicated groups. Veh: vehicle.
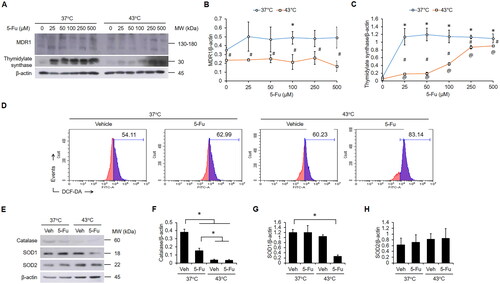
Figure 5. PD-L1 expression after hyperthermia and 5-Fu treatment. (A–C) Cells were treated with or without increasing doses of 5-Fu at 37 or 43 °C for 1 h, followed by incubation at 37 °C for 23 h. Levels of glycosylated PD-L1 and non-glycosylated PD-L1 were measured by western blotting. Quantification of bands was performed using ImageJ. (D,E) Surface PD-L1 was detected by flow cytometry. *: p < 0.05 compared to 0 μM 5-Fu at 37 °C. @: p < 0.05 compared to 0 μM 5-Fu at 43 °C. #: p < 0.05; significant difference between indicated dose of 5-Fu at 37 and 43 °C.
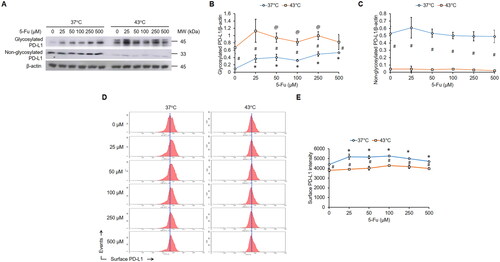
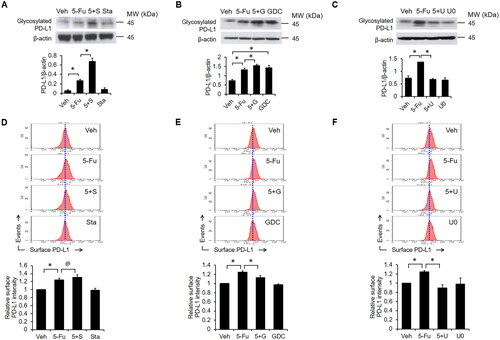
Figure 6. Roles of STAT3, Akt and ERK in 5-Fu-mediated PD-L1 upregulation. (A) Cells were pretreated with Stattic (5 μM) for 1 h, followed by 5-Fu (25 μM) at 37 °C for 23 h. Levels of glycosylated PD-L1 were measured by western blotting. (D) Surface PD-L1 was detected by flow cytometry. (B) Cells were pretreated with GDC-0068 (100 nM) for 1 h, followed by 5-Fu (25 μM) at 37 °C for 23 h. Levels of glycosylated PD-L1 were measured by western blotting. (E) Surface PD-L1 was detected by flow cytometry. (C) Cells were pretreated with U0126 (10 μM) for 1 h, followed by 5-Fu (25 μM) at 37 °C for 23 h. Levels of glycosylated PD-L1 were measured by western blotting. (F) Surface PD-L1 was detected by flow cytometry. *: p < 0.05: significance between indicated groups. @: p > 0.05. Veh: vehicle; 5 + S: 5-Fu + Stattic; 5 + G: 5-Fu + GDC-0068; 5 + U: 5-Fu + U0126; Sta: Stattic; GDC: GDC-0068; U0: U0126.
Data availability statement
All data generated during this study and included in this published article.