
Figures & data
Figure 1. Formation of RT4 organoid. (A) a timeline of RT4 organoid-related experiments created using BioRender.com. (B) Representative bright-field images of organoids formed from the RT4 cell line on day 2 and day 12. Scale bar, 100 μm.
(C) Representative H&E staining photomicrograph of RT4 organoids on day 12. Scale bar, 50 μm. (D) Representative immunofluorescence sections of RT4 organoids stained with Ki67 (red). Nuclei were stained with DAPI. Scale bar, 50 μm.
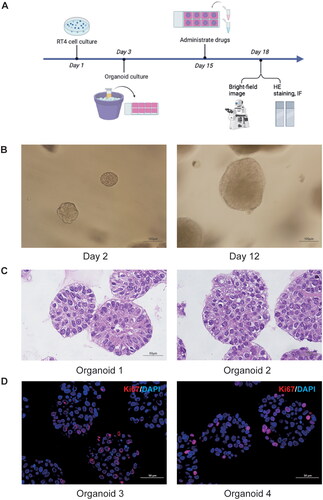
Figure 2. Hyperthermia chemotherapy influences organoid shape and size. (A, B) Representative bright-field images of RT4 organoids treated with gemcitabine (0-10 μM) and pirarubicin (0-10 μM) at 37 °C and 42 °C. (C) Quantitative analysis of the organoid area in the gemcitabine and the pirarubicin group. The mean ± SEM of 6 organoids per group is shown. Two-way ANOVA analyzed the differences between groups with multiple comparisons. *p < 0.05. (D, E) Representative images with H&E staining of organoids treated with gemcitabine and pirarubicin at 37 °C and 42 °C were shown. Scale bar, 50 μm.
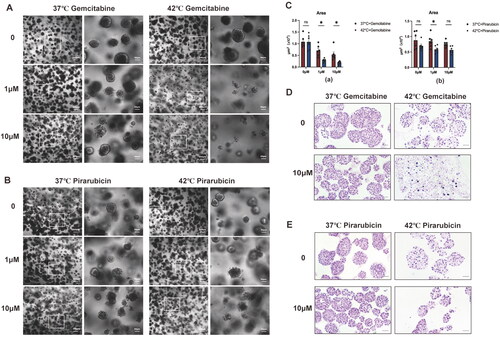
Figure 3. Hyperthermia chemotherapy inhibits the proliferation of RT4 organoids. (A, B) Representative immunofluorescence sections of RT4 organoids treated with gemcitabine (0-10 μM) and pirarubicin(0-10 μM) in 37 °C and 42 °C, stained with Ki67 (red). Nuclei were counterstained with DAPI. (C, D) Quantitative analysis of Ki67+ organoids per field and Ki67+ nuclei per organoid in the gemcitabine(0-10 μM) and the pirarubicin (0-10 μM) groups at 37 °C and 42 °C. Differences between groups were analyzed using two-way ANOVA with multiple comparisons. *p < 0.05, **p < 0.01. ***p < 0.001, ****p < 0.0001.
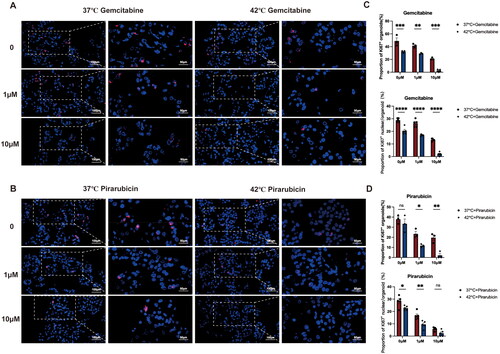
Figure 4. Hyperthermia chemotherapy accelerates the apoptosis of RT4 organoids. (A, B) Representative images of TUNEL staining (green) of RT4 organoids treated with gemcitabine (0-10 μM) and pirarubicin (0-10 μM) in 37 °C and 42 °C are shown. Nuclei were stained with DAPI. (C, D) Quantitative analysis of TUNEL+ organoids per field and TUNEL+ nuclei per organoid in the gemcitabine (0-10 μM) and the pirarubicin (0-10 μM) group at 37 °C and 42 °C.The differences between groups were analyzed using two-way ANOVA with multiple comparisons. *p < 0.05, **p < 0.01, ***p < 0.001, ****p < 0.0001.
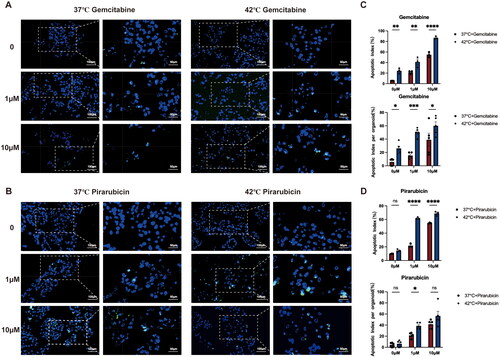
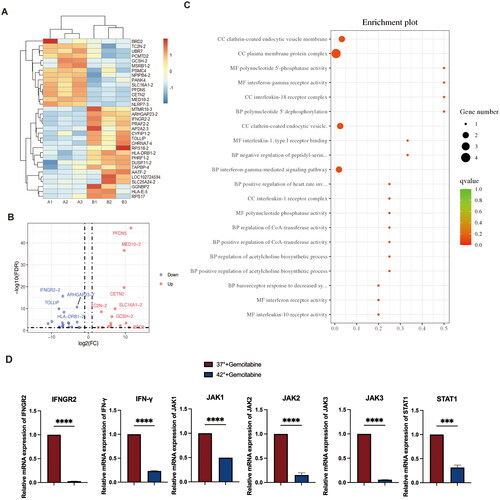
Figure 5. RNA sequencing and RT-qPCR analysis of RT4 cell lines revealed differential gene expression between the groups treated with gemcitabine at 37 °C and 42 °C. (A, B) Heatmap and volcano plot illustrating the differentially expressed genes in RT4 cells between the hyperthermia with gemcitabine group (A1, A2, A3) and the gemcitabine group (B1, B2, B3). (C) Gene ontology (GO) enrichment analysis of RT4 cells treated with gemcitabine (0.01 μM) at 37 °C and 42 °C. (D) RT-qPCR assay for IFNGR2, IFN-γ, JAK1, JAK2, JAK3, and STAT1 mRNA levels. The differences between groups were analyzed using an unpaired t-test. ***p < 0.001, ****p < 0.0001.
Supplemental Material
Download Zip (3.6 MB)Data availability statement
All data presented in this study can be accessed upon inquiry to the corresponding author.