
Figures & data
Figure 1. Photo of experimental setup of the in vivo FUAS on a live goat.
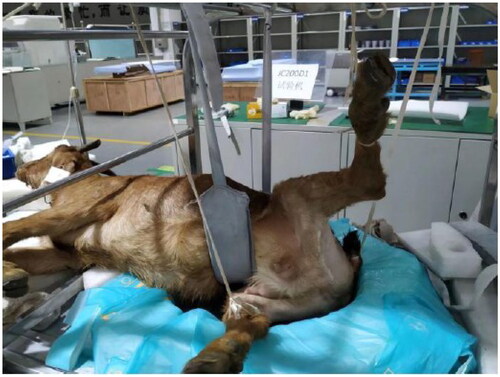
Table 1. Comparison of echo amplitude changes of the FUS transducer and gray levels in sonography and FUAS-induced lesion areas in the liver of goats.
Table 2. Comparison of echo amplitude changes of the FUS transducer and gray levels in sonography and FUAS-induced lesion areas in the kidney of goats.
Table 3. Comparison of echo amplitude changes of the FUS transducer and gray levels in sonography and FUAS-induced lesion areas in the leg muscle of goats.
Figure 2. Comparison of sonography (a) before and (b) after FUAS to the liver of the #1 live goat at six different positions, and (c) the corresponding coagulative necrosis after the dissection of treated samples.
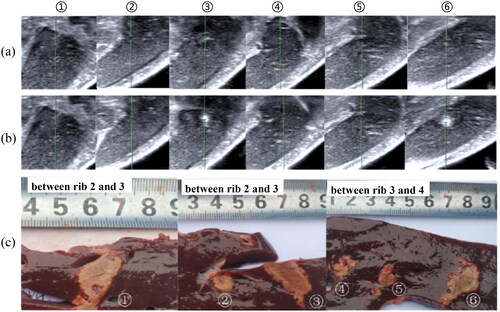
Figure 3. Damage caused by FUAS in the kidney tissues of the #2 live goat (yellow arrow: coagulation necrosis, red arrow: congestion).
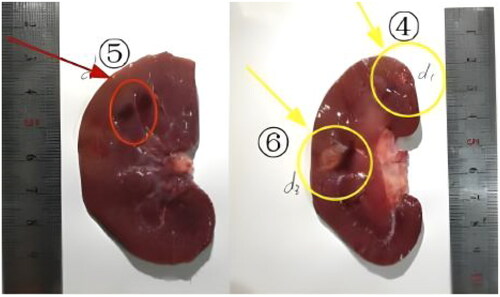
Figure 4. Coagulative necrosis in the leg muscles of the #1 live goat at six different positions after FUAS.
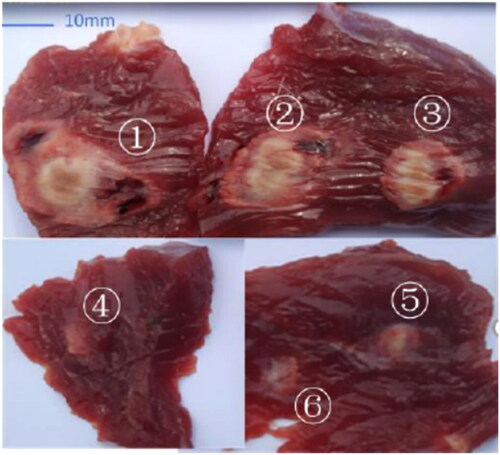
Figure 5. Comparison of sonograhy of treatment point ⑤ in the leg muscles in the #3 live goat (a) before and (b) after FUAS, and (c) the corresponding echo signals from the focal region.
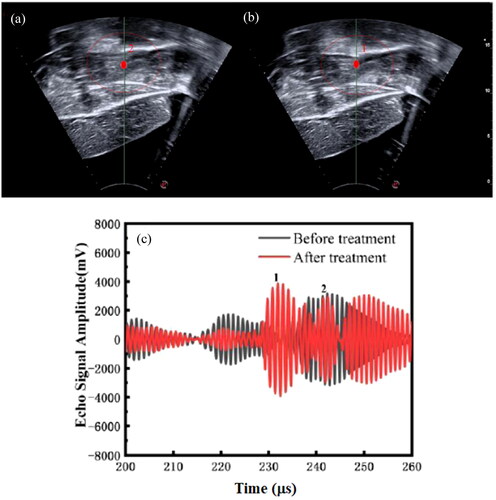
Table 4. FUS echo difference of treatment points with/without grayscale changes in B-mode sonography.
Data availability statement
The data presented in this study are available on request from the corresponding author.