Figures & data
Figure 1. Flow chart of animal model establishment; a: RFA group and non RFA group; B: control group.
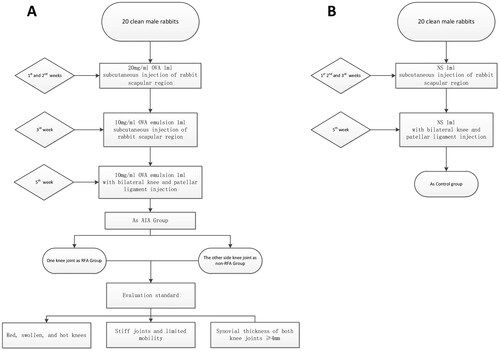
Figure 2. Flow chart of synovial ablation and postoperative treatment; A: synovial ablation; B: postoperative treatment.
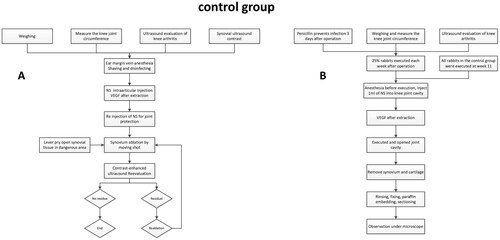
Figure 3. Weight and knee circumference change over time; A: weight-time change curve; B: knee circumference-time change curve; C: two-way ANOVA of weight-time change residual plots; D: two-way ANOVA of residual plots of circumference time change. In statistical comparisons, the RFA group differed significantly from the Control group (aP < .05), the RFA group from the non-RFA group (bP < .05), and the non-RFA group from the Control group (cP < .05). *p < .05, **p < .01, ***p < .001.
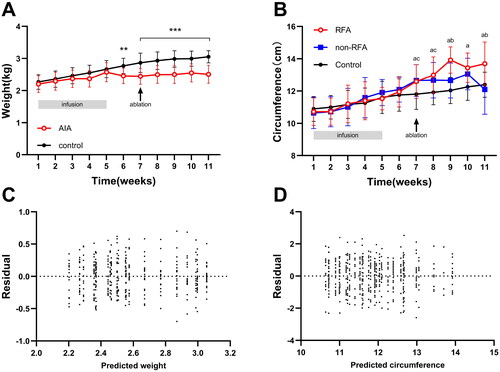
Figure 4. Observations after synovial ablation; A: ultrasound assessment of knee effusion depth; B: ultrasound assessment of synovial hyperplasia thickness; C: ultrasound semi-quantitative assessment of synovitis score; D: skin ulcer diameter before and after ablation (*p < .05, **p < .01, ***p < .001).
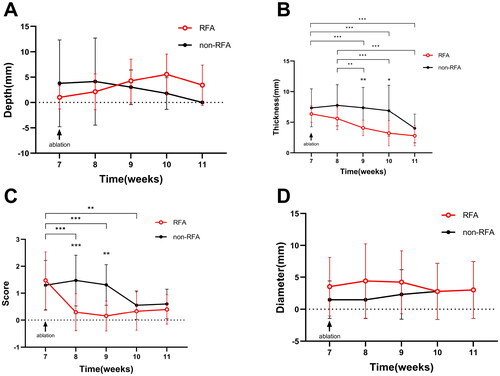
Table 1. Comparison of the knees in the RFA and non-RFA groups after modeling.
Figure 5. Bilateral knee ultrasound evaluation and monitoring during synovial ablation; A, B: non-RFA side of knee synovial (↑) thickness 6 mm, CDFI synovitis score 1 (↑); C: ultrasound-guided synovial ablation showing RFA pin (↑); D, E: same rabbit RFA side of knee synovial thickness (↑) 7 mm, CDFI synovitis score 1 (↑); F: synovial ablation with CDFI showed annular shape (↑).
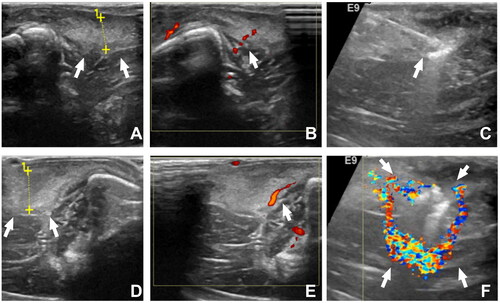
Figure 6. CEUS for monitoring and evaluating the effectiveness of synovial ablation; A: preoperative CEUS showing highly hyperplastic synovium (↑); B: CEUS monitoring during ablation showing residual synovium (↑); C: CEUS after re-ablation showing no residual synovium (↑).
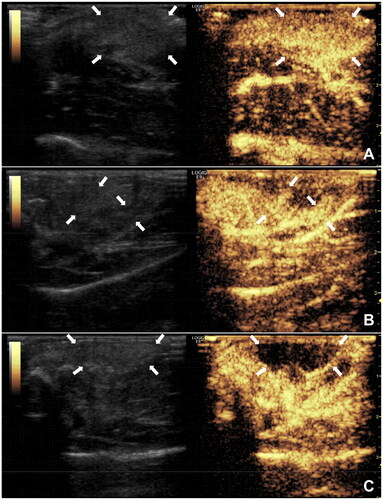
Table 2. Correlation analysis between time (s) of RFA and synovial thickness, knee effusion, and skin rupture in AIA group.
Table 3. Comparison of evaluation indexes before and after ablation between RFA group and non-RFA group.
Figure 7. Anatomy of rabbit knee joint in AIA group, A: increased synovial vascular thickening 1 week after surgery in non-RFA group (↑); B–C: after synovial ablation in RFA group, B is 2 weeks after surgery, synovial membrane is lumpy or cheese-like (↑), C is 4 weeks after surgery, synovial membrane is milky white viscous fluid (↑); D: joint surface has intact ligaments and rough cartilage (↑).
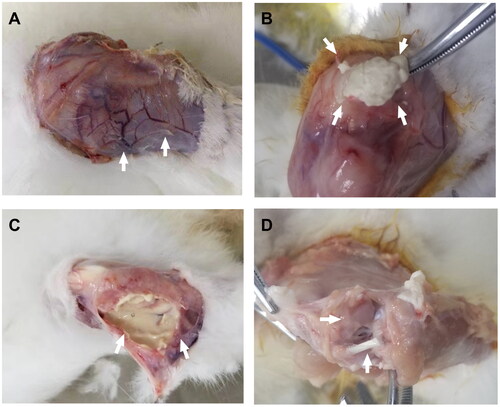
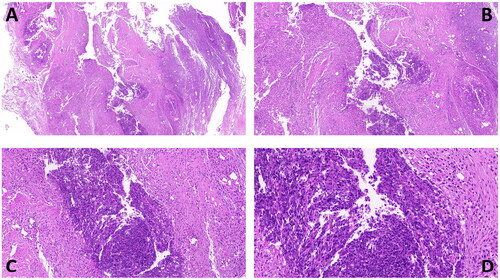
Figure 8. Histopathological histology of synovial tissue after ablation showing necrosis of synovial tissue. 5× (A), 10× (B), 20× (C), 40× (D).