
Figures & data
Figure 1. Study design flow chart.
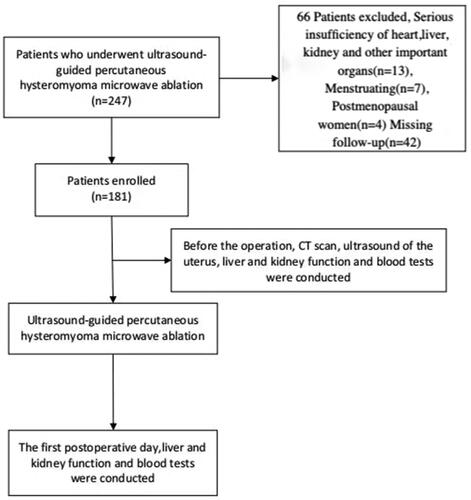
Table 1. Comparison Of liver function before and after UPMWA.
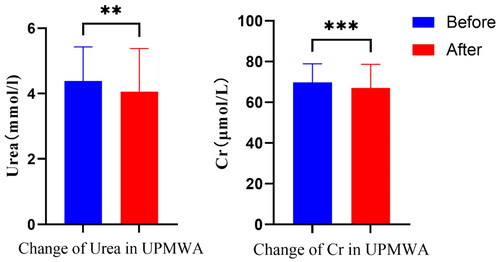
Table 2. Comparison of kidney function before and after UPMWA.
Table 3. Comparison of RBC and HGB levels before and after UPMWA.
Figure 2. The comparison of the values of liver function before and after UPMWA. (*p < 0.05, as determined by a t-test comparing the values before and after UPMWA).
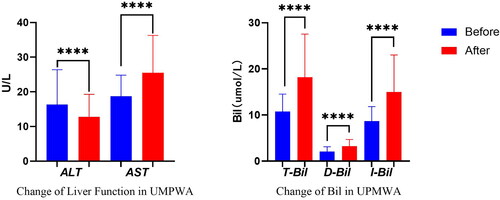
Figure 3. The comparison of the values of RBC and HGB before and after UPMWA. (*p < 0.05, as determined by a t-test comparing the values before and after UPMWA).
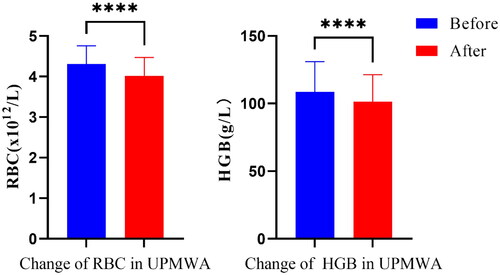
Figure 4. The comparison of the values of kidney function before and after UPMWA. (*p < 0.05, as determined by a t-test comparing the values before and after UPMWA).
Data availability statement
The data are not publicly available due to their containing information that could compromise the privacy of research participants.