
Figures & data
Figure 1. Photographs of goniometry measurement of the ankle range of motion with the knee stabilized in (a) full extension of 0°, (b) flexion of 90°, and (c) flexion of 135° flexion, while the angle of the ankle at maximal dorsiflexion was measured.
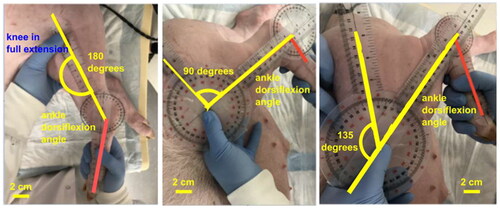
Table 1. Summary of MRI and PRF-based MRT pulse sequence parameters.
Figure 2. T2-weighted MRI image of the Achilles tendon used in treatment planning of MRgFUS sonication. Treatment target is verified in the (a) sagittal, (b) axial, and (c) coronal views.
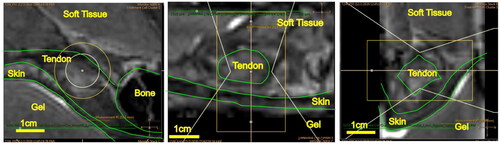
Table 2. Summary of treatment groups designation and results of tendons ruptured and goniometry range of motion change for each treatment group.
Figure 3. T2-weighted MRI image of the Achilles tendon with MR thermometry (PRFS-MRT) at the end of the MRgFUS thermal ablation sonication showing the maximum temperature achieved for Group 2B (pulsed FUS and 900 J). Temperature mapping corresponds to the scale (blue = 40°, yellow = 55°, red = 70°) displayed on the right for PRFS-MRT in (a) sagittal, (b) axial, and (c) coronal views. The white lines represent the sonication cone; the yellow lines represent the treatable sonication region.
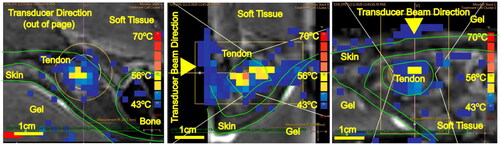
Figure 4. MRI image of the Achilles tendon with MR thermometry (PRFS-MRT) at the end of MRgFUS sonication showing the maximum temperature achieved for Group 2 A (900 J only). Temperature mapping corresponds to the scale displayed on the right for PRFS-MRT in (a) sagittal, (b) axial, and (c) coronal views. The white lines represent the sonication cone; the yellow lines represent the treatable sonication region.
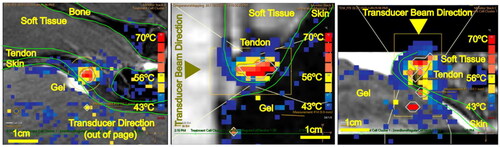
Table 3. Summary of maximum temperatures for each treatment group at three timepoints.
Table 4. Summary of skin necrosis for each treatment group.
Supplemental Material
Download MS Word (307.5 KB)Data availability statement
Raw data were generated at the Posluns Center for Image Guided Innovation and Therapeutic Intervention, The Hospital for Sick Children. Derived data supporting the findings of this study are available from the corresponding author WCK on request.