
Figures & data
Table 1. The synthesis report sheet of siRNA sequences.
Table 2. Primer sequences of PCR.
Figure 1. ITA promotes the biological progression of residual liver cancer cells. (A–B) CCK-8 assays were performed to detect the proliferative capacity of heat-stressed liver cancer cells. (C–E) Transwell migration and invasion assays were conducted to evaluate the migratory and invasive abilities of heat-stressed liver cancer cells (magnification, ×100). (F–G) Scratch assays to measure changes in the migration capacity of liver cancer cells after heat stress (magnification, ×100).
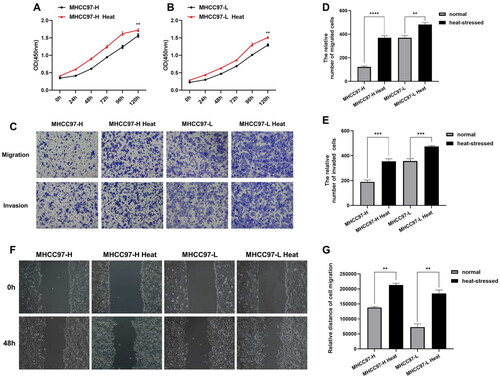
Figure 2. Upregulation of NDST2 expression in heat-stressed liver cancer cells. (A–B) RT-qPCR experiments were conducted to measure the expression changes of NDST2 in heat-stressed liver cancer cells. (C) Tissue sequencing results of residual tumor tissues in a nude mouse model showing increased NDST2 expression in incomplete ablation tumor tissues. (D–E) Western Blot assays to detect NDST2 protein levels in heat-stressed cells.
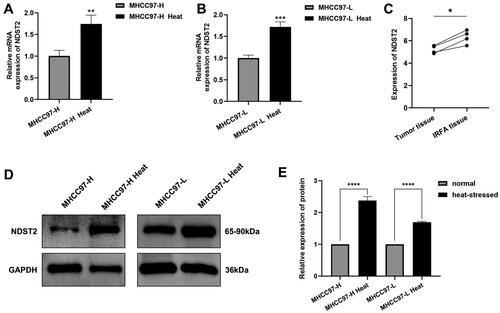
Figure 3. (A) Differential expression of NDST2 between tumor and non-tumor tissues among 26 types of TCGA cancers. (B) Data analysis from GEO, ArrayExpress, and TCGA databases comparing HCC tumors with non-tumor tissues, verifying the high expression of NDST2 in HCC. (C) sROC curve evaluating the potential of NDST2 differential expression as a discriminator in HCC (p = 0.01). (D) Cox regression analysis identifying the predictive value of NDST2 for overall survival in HCC patients.
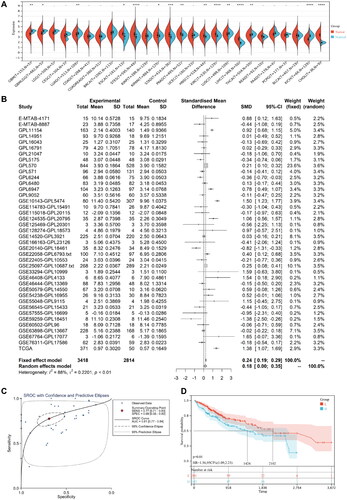
Figure 4. Genetic mutation landscape of NDST2 in liver cancer. (A) Lollipop plot displaying the distribution of NDST2 gene mutations, with missense mutations having a mutation frequency of 0.56%. (B) Overview of major mutations in liver cancer patients. The waterfall plot compares the mutation frequencies of NDST2 with the top 10 mutated genes in liver cancer patients, showing a very low mutation frequency for NDST2.
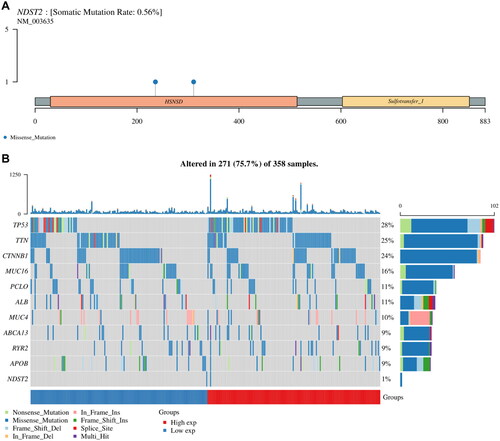
Figure 5. Immune infiltration analysis of NDST2 in liver cancer. (A-B) Relative abundance of tumor-infiltrating immune cells in high-expressing NDST2 (G1) and low-expressing NDST2 (G2) liver cancer specimens. (C) Distribution of immune checkpoint gene expression in liver cancer samples with high expression of NDST2 (G1) and low expression of NDST2 (G2). (D) Network diagram depicting the correlation between NDST2 expression and tumor-infiltrating immune score, together with the correlation of the immunity scores themselves.
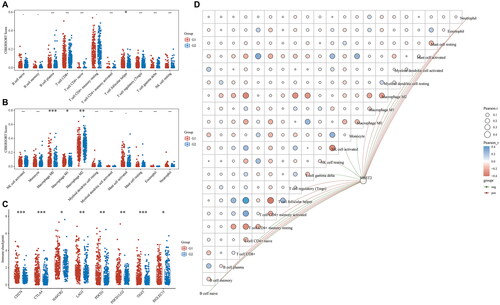
Figure 6. Biological progress of NDST2 downregulation in heat-stressed liver cancer cells. (A) Three transfection reagents were used to transfect the heat-stressed liver cancer cells, and the RT-qPCR results showed a decrease in NDST2 expression after transfection. Among them, siNDST2-1 exhibited the best transfection effect. (B) Western Blot experiments detected the knockdown effect of siNDST2-1, resulting in a decrease in NDST2 protein level after knockdown. (C) Western Blot results of MHCC97-H and MHCC97-L heat-stressed cells after knockdown. (D) The impact of NDST2 knockdown on the proliferation capacity of heat-stressed cells was determined using CCK-8 assays.
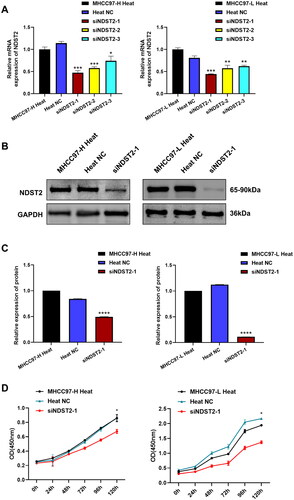
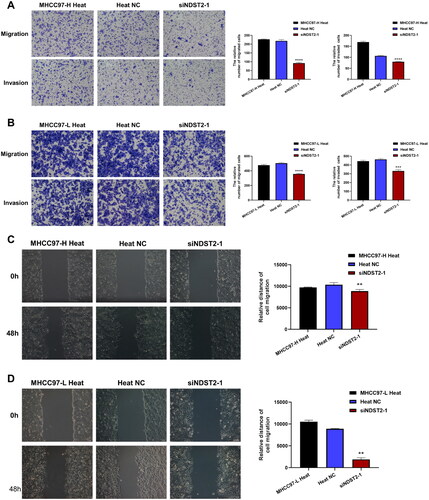
Figure 7. The locomotion and invasion abilities of heat-stressed liver cancer cells are altered after downregulation of NDST2. (A) Locomotion and invasive ability of heat-stressed liver cancer cells after MHCC97-H knockdown assessed by Transwell assays (magnification, ×100). (B) Locomotion and invasive ability of heat-stressed liver cancer cells after MHCC97-L knockdown assessed by Transwell assays (magnification, ×100). (C) Scratch assays measured the change in migration area of MHCC97-H heat-stressed cells after NDST2 knockdown (magnification, ×100). (D) Scratch assays measured the change in migration area of MHCC97-L heat-stressed cells after NDST2 knockdown (magnification, ×100).
Supplemental Material
Download MS Word (1.6 MB)Data availability statement
TCGA dataset (https://portal.gdc.com), ArrayExpress dataset (https://www.ebi.ac.uk/arrayexpress/), GEO dataset (https://www.ncbi.nlm.nih.gov/geo/) and STRING database (http://www.string-db.org/) were used in the study. The datasets used and analyzed during the current study are available from the corresponding author on reasonable request. And the Nude Mice sequencing datasets generated and analyzed during the current study are available in the GEO repository (record GSE234283). The following secure token has been created to allow review of record GSE234283 while it remains in private status: cvebmegybtgdvqr.