
Figures & data
Figure 1. Cell survival after hyperthermia of endothelial cells, smooth muscle cells, keratinocytes, and neuronal cells. Fits for survival data is also shown through the line plots. Survival fractions are relative to the ATP levels at exposure to 37 °C. Dots indicates the median of the cell data (n = 9), with error bars indicating the full range. Line plots indicate the Arrhenius damage model for thermal damage, error bands show the 95% CI. bars indicate the standard deviation of the median.
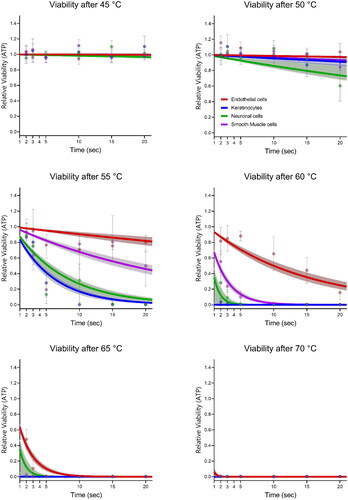
Figure 2. Temperature and time combinations that result in reduction of cell viability by 50% (LT50) of the linear interpolated points (symbols, n = 9, median with 95%CI) and the fitted LT50s using the Arrhenius model (lines, median, 95% CI, n = 5000). Significance levels of differences between the cell types are indicated with * for p < 0.0001 at α = 0.05.
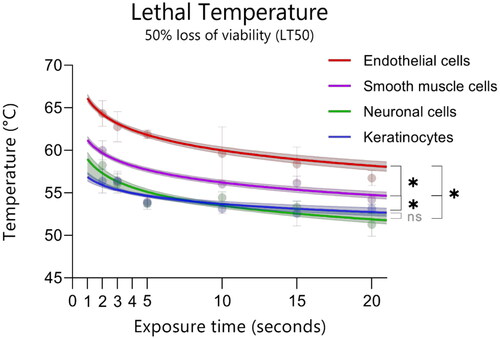
Table 1. CEM43 Values of thermal damage per cell type. Time (h) to reach 50% loss of survival at 43 °C was extrapolated from the Arrhenius curves for LT50.
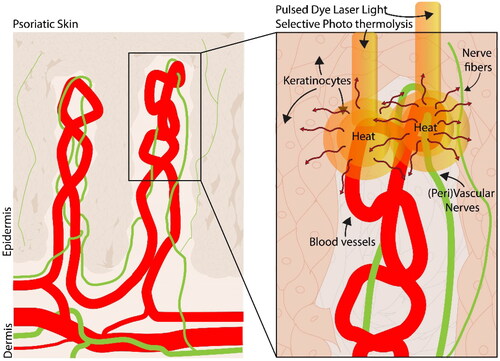
Figure 3. Illustration of heat diffusion of pulsed dye laser light from the blood vessels where the chromophore oxyhemoglobin resides toward the surrounding areas. These could include the (peri)vascular nerves, free nerve fiber endings, and keratinocytes.
Data availability statement
The data that support the findings of this study are openly available in figshare at 10.6084/m9.figshare.24467440 (data under embargo till publication).