
Figures & data
Table 1. Baseline patient characteristics.
Table 2. Characteristics of lesions and treatment outcomes.
Figure 1. Change in tumor volume percentage before RFA and RT and at each follow-up.
Error bars represent the standard error of the mean; ***p ≤ 0.001
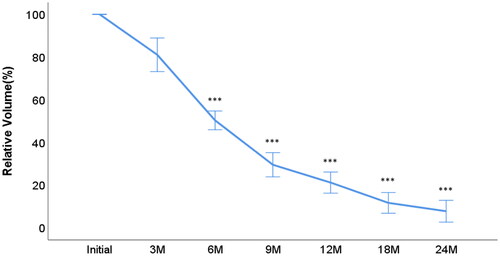
Figure 2. A 63-year-old man with recurrent thyroid cancer.
(a) contrast-enhanced CT before RFA and RT, showing one enhanced mass invading the tracheal wall and esophageal wall; (b) PET-CT before RFA and RT, showing increased FDG uptake in the paratracheal mass lesion (SUV max: 22.25); (c) contrast-enhanced CT 39 months after RFA and RT, showing that the recurrent tumor had almost completely disappeared; (d) PET-CT 6 months after RFA and RT, showing background FDG avidity with complete metabolic response in the left paratracheal region; CT, computed tomography; RFA, radiofrequency ablation; RT, radiotherapy; PET-CT, positron emission tomography and computed tomography; FDG: fludeoxyglucose F-18; SUV max, maximum standardized uptake value
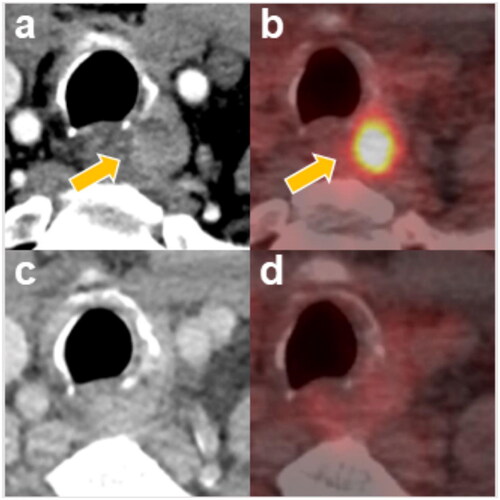
Figure 3. The relationship between relative tumor volume and relative Tg in patients with localized recurrent disease and initial detectable Tg (Pearson correlation coefficient, 0.886; p < 0.001).
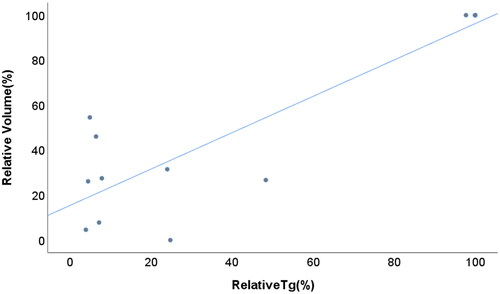
Figure 4. (A) OS and (B) locoregional PFS of eligible patients after salvage RFA and RT.
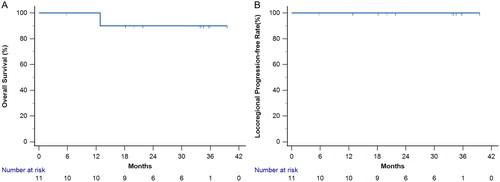
Table 3. Incidence of toxicity.
Data availability statement
Research data are available upon request to the corresponding authors.