
Figures & data
Figure 1. MWA combined with TGF-β1 inhibitor decreases survival rate of HCC cells. (A) Chemical structure of SB-525334. (B) Schematic illustration of MWA combined with TGF-β1 inhibitor (SB-525334). (C) Time temperature curve under 15 W MWA. (D) The IC50 value of SB-525334 was measured in HepG2 and Huh7 cells via MTT assays. (E) MTT assays to detect the role of MWA combined with SB-525334 in cell survival at different temperatures. Data were analyzed by one way analysis of variance followed by Tukey’s post hoc analysis and Student’s t test and expressed as mean ± SD of three independent experiments. *p < .05, **p < .01, ***p < .001 vs. NS (37 °C) group.
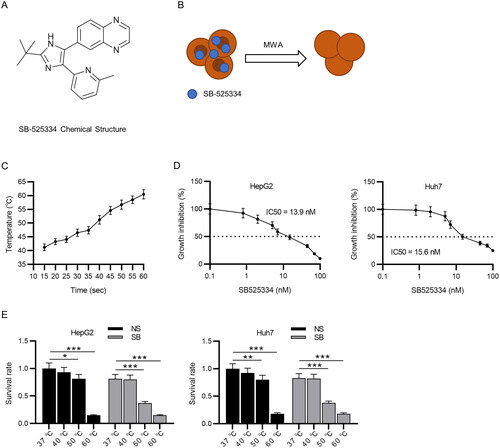
Figure 2. MWA combined with TGF-β1 inhibitor promotes the apoptosis of HCC cells. (A) CCK-8 assays to evaluate cell viability in the control (37 °C) + NS, the control (37 °C) + SB, the MWA (50 °C) + NS and the MWA (50 °C) + SB groups. (B–C) The apoptosis of HepG2 and Huh7 cells was assessed via flow cytometry. (D–E) Western blotting to measure the protein levels of cleaved caspase-3, caspase-9 and PARP in HepG2 and Huh7 cells. Data were analyzed by one-way analysis of variance followed by Tukey’s post hoc analysis and expressed as mean ± SD of three independent experiments. *p < .05, **p < .01, ***p < .01.
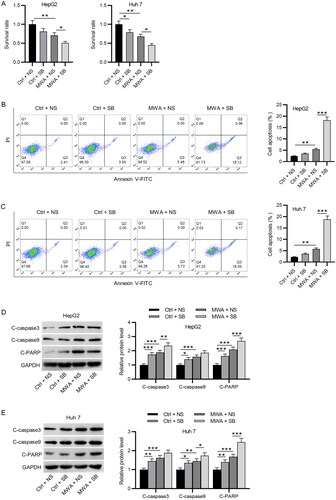
Figure 3. TGF-β1 inhibitor effectively inactivates the TGF-β1/Smad2/Smad3 pathway in HCC cells. (A–B) Western blotting to assess the protein levels of TGF-β1, phosphorylated Smad2, and phosphorylated Smad3 in HepG2 and Huh7 cells. Data were analyzed by one way analysis of variance followed by Tukey’s post hoc analysis and expressed as mean ± SD of three independent experiments. *p < .05, **p < .01, ***p < .001.
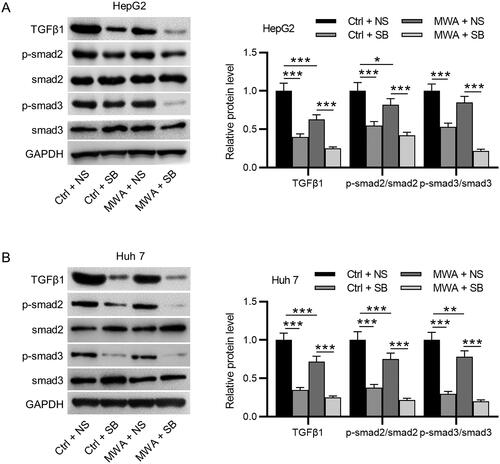
Figure 4. MWA combined with TGF-β1 inhibitor inhibits tumor growth and histopathological changes in vivo. (A) The gross manifestation of tumors on day 22 after MWA. (B) Changes in tumor volume were recorded at the indicated time points. (C) Immunohistochemistry staining was used to detect the expression of Ki67. (D) Histopathological changes of tumor tissues were examined by hematoxylin and eosin staining, and quantification of tumor infiltration area, blood vessel density, cells with nuclear collapse and cells with condensed chromatin was conducted. Black and red arrows represent blood vessels and tumor infiltration, respectively. Blue arrow represents nuclear deformation and chromatin condensation. (E) TUNEL staining was performed to assess tumor apoptosis. Data were analyzed by one way analysis of variance followed by Tukey’s post hoc analysis and expressed as mean ± SD of three independent experiments. N = 5 mice each group. *p < .05, **p < .01, ***p < .001.
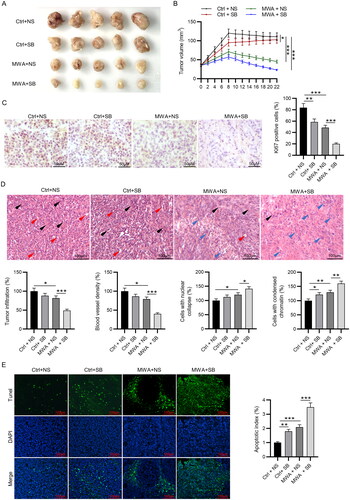
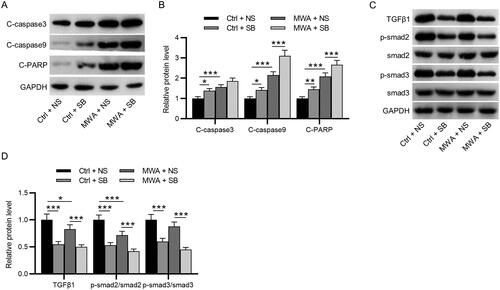
Figure 5. MWA combined with TGF-β1 inhibitor promotes the apoptosis of tumor cells by inactivating the TGF-β1/Smad2/Smad3 in vivo. (A–B) Western blotting to measure the protein levels of cleaved caspase-3, cleaved caspase-9 and cleaved PARP. (C–D) Western blotting to measure the protein levels of TGF-β1, phosphorylated Smad2 and phosphorylated Smad3. Data were analyzed by one-way analysis of variance followed by Tukey’s post hoc analysis and expressed as mean ± SD of three independent experiments. N = 3 mice each group. *p < .05, **p <.01, ***p < .001.
Data availability statement
The datasets used or analyzed during the current study are available from the corresponding author on reasonable request.