
Figures & data
Figure 1. Example of SEEG electrode consisting of metal contacts joined in pairs. The internal contacts are inserted in the brain, while the external contacts are accessible for mapping, stimulation or applying RF power.
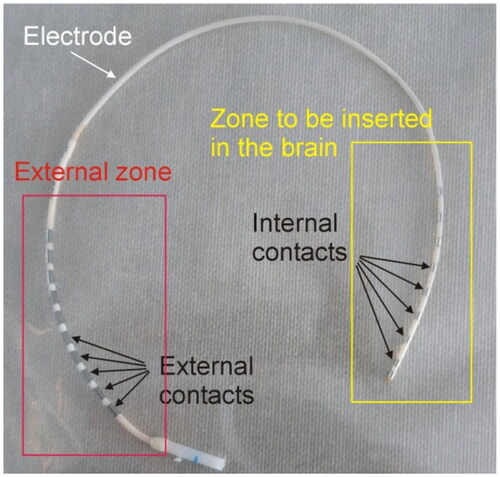
Figure 2. (A) Overview of the experimental setup used in the ex vivo experiments. (B) Detail of the microthermocouple attached to the electrode surface to assess self-heating caused by the resistance of the internal wires connecting the external and internal contacts.
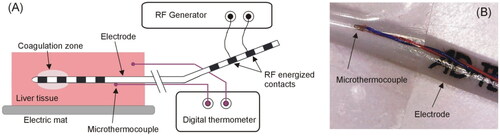
Figure 3. Computer model geometry including the distal section of the electrode and a pair of metal contacts (not to scale).
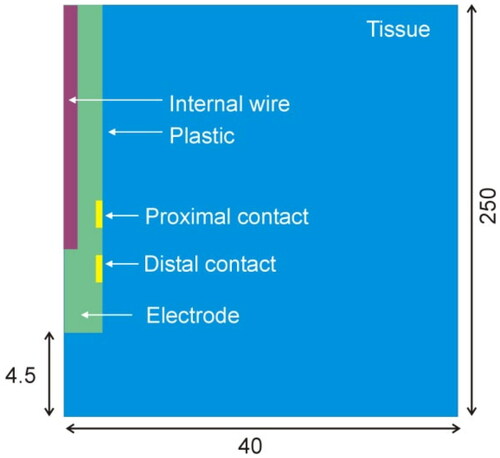
Table 1. Thermal and electrical characteristics of the elements in the model.
Figure 4. (A) Geometry of the computer model used to study coagulation zone changes when two RF-energized contacts are surrounded by different neural tissue (gray vs. white matter). (B) Geometry of the computer model used to study coagulation zone changes when a peri-electrode gap filled by cerebrospinal fluid (CSF) is considered around the electrode (out of scale). The outer dimensions were as shown in .
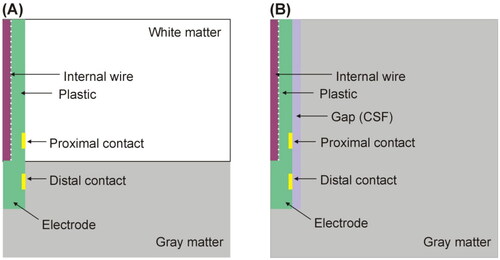
Figure 5. Evolution of applied power (A) and electrical impedance (B) during ex vivo experiments. The results are shown as the mean value (blue symbol) ± standard deviation (black vertical bars).
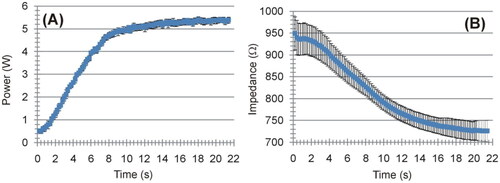
Figure 6. Evolution of the temperature measured on the plastic electrode surface, see ) at a point away from the coagulation zone.
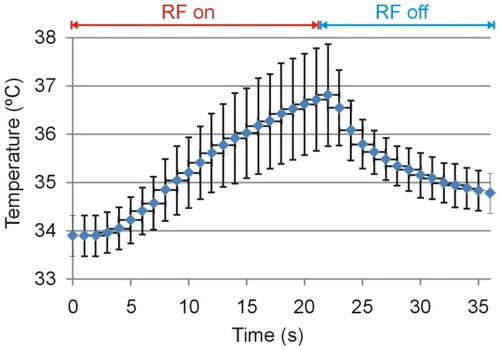
Figure 7. (A,B) Typical coagulation zones created after RF-TC during ex vivo experiments. The dimensions (in mm) are the mean and standard deviation of the length and diameter. (C) Computer results: Temperature distributions after 21.4-s RF-TC (scale in °C). The coagulation boundary was assessed by the 55 °C and 60 °C isotherms. Vertical black solid lines represent the position of the metal contacts.
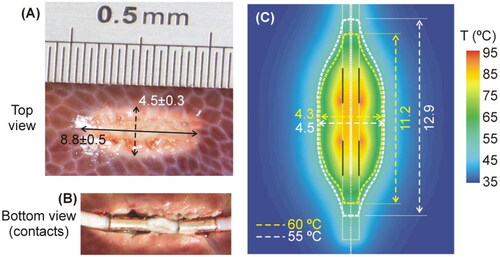
Figure 8. (A) Evolution of the electrical impedance during ex vivo experiments (mean and standard deviation) (B) Comparison between computer results (red line) and mean values of the experiments (blue line).
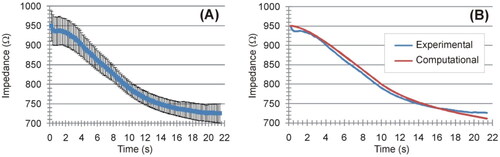
Figure 9. Relationships between applied power and coagulation zone size (maximum diameter and length) and time at impedance roll-off.
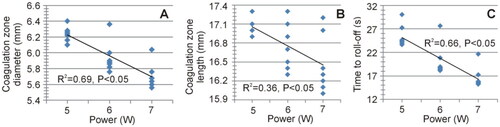
Figure 10. Relationships between the delivered total energy and the maximum diameter of the coagulation zone.
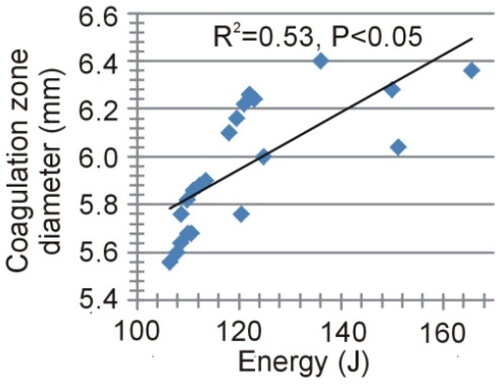
Figure 11. Temperature distributions at roll-off for different cases of neural tissue around the contacts (scale in °C) according to the model shown in (6 W applied power): white matter (a), gray matter (B), three different positions of the gray-white matter interface (indicated by a solid black line) (C − E). The coagulation boundary (white dashed line) is that of the 55 °C isotherm. The solid gray line indicates the electrode contour. The black arrows on panel B indicate the hot points at the ends of each contact when closest to each other.
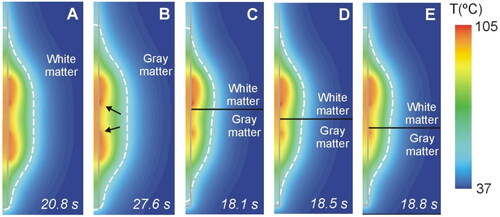
Figure 12. Relationship between applied power and coagulation zone size (maximum diameter and length).
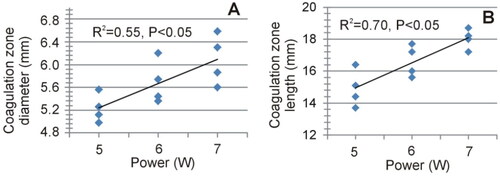
Figure 13. Temperature distributions at 30 s for different values of gap thickness (scale in °C) according to the model shown in (6 W applied power). The coagulation boundary (white dashed line) is that of the 55 °C isotherm.
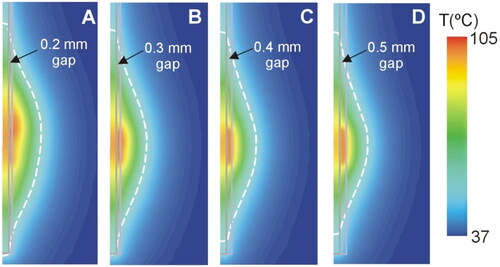
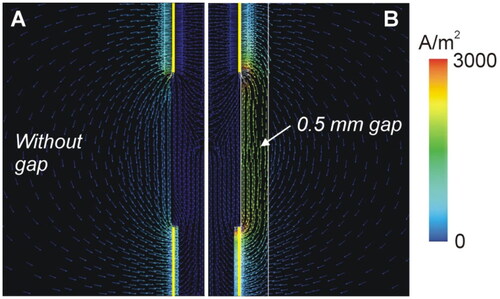
Figure 14. Electrical current density distributions in cases without (A) and with (B) a 0.5 mm peri-electrode gap filled by CSF (computed at the beginning of the RF coagulation, 0.1 s). Scale in a/m2.
Supplemental Material
Download Zip (180.2 KB)Data availability statement
The authors confirm that the data supporting the findings of this study are available within the article and its supplementary materials.