
Figures & data
Figure 1. Flowchart of patient enrollment.
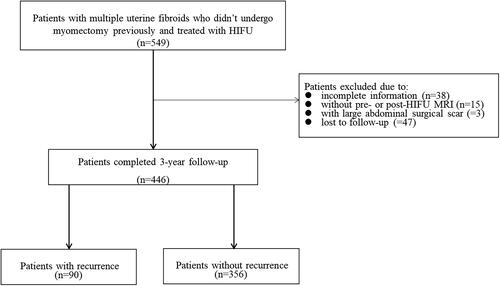
Figure 2. Signal intensity of uterine fibroids on T2WI of MRI. A: multiple uterine fibroids with hypointensity signal; B: multiple uterine fibroids with isointensity signal; C: multiple uterine fibroids with hyperintensity signal; D: multiple uterine fibroids with mixed hyperintensity signal.
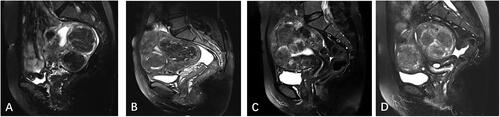
Figure 3. Enhancement of multiple uterine fibroids on contrast enhanced MRI. A: multiple uterine fibroids with mild enhancement; B: multiple uterine fibroids with moderate enhancement; C: multiple uterine fibroids with significant enhancement.
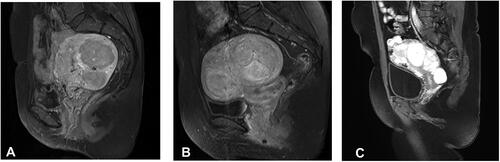
Table 1. Comparison of baseline characteristics between the recurrence group and the non-recurrence group.
Table 2. Comparison of treatment results between patients with recurrence and patients without recurrence.
Table 3. Comparison of recurrence rate and adverse events between two medical centers.
Figure 4. Prognostic calibration analysis. The blue line represented the model line, and the gray line represented the optimal prognosis model. The more similar the linear fit between the two lines, the better the model fits.
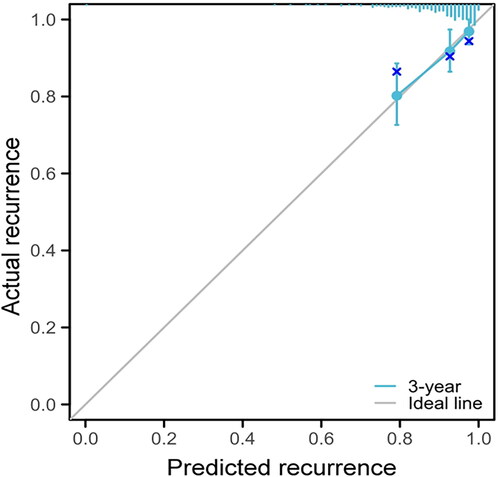
Table 4. Univariate and multivariate Cox analysis of factors that affecting the recurrence of uterine fibroids after USgHIFU treatment.
Figure 5. The ROC curve analysis of each independent influencing factor.
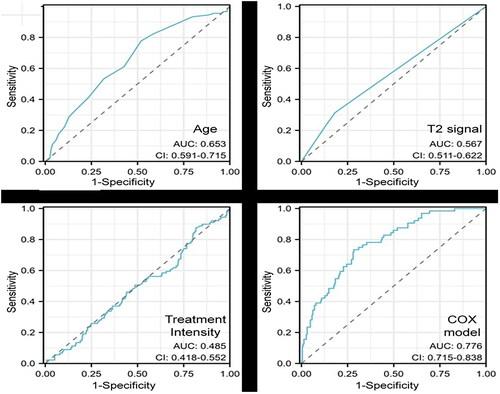
Table 5. ROC curve analysis.
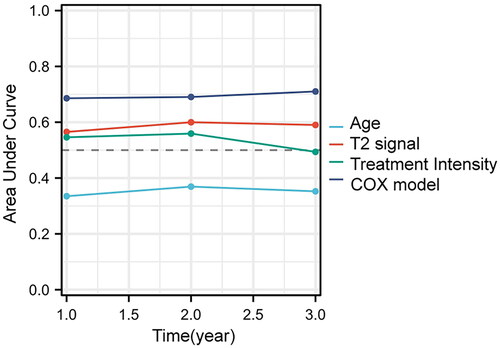
Figure 6. Time dependent area under curve (AUC). The large AUC indicates a high prediction efficiency of the model.
Data availability statement
The data that support the findings of this study are available upon request from the corresponding author, LZ. The data are not publicly available because they contain information that can compromise the privacy of the research participants.