
Figures & data
Table 1. Magnetic resonance imaging parameters.
Figure 1. The lower relative signal intensity of leiomyomas on SWI after MRgFUS treatment. The left, Middle, and right figures show the CE, SWI imaging, and SWI sketch of the same leiomyoma. (Left) The axial CE imaging shows the ablated necrotic lesion is observed as non-enhancing hypointense zones (star), and surrounding residual leiomyoma appeared as enhancing hyperintense zones (arrow). (Middle) the corresponding axial SWI shows the signal intensity of the ablated necrotic lesion (star) is lower than the surrounding residual leiomyoma (arrow). (Right) the sketch map illustrates the extent of the ablated lesion (black area) and residual leiomyoma (white area).
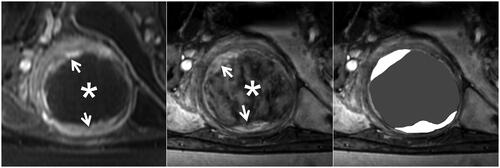
Figure 2. The similar relative signal intensity of leiomyomas on SWI after MRgFUS treatment. The left, Middle, and right figures show the CE, SWI imaging, and SWI sketch of the same leiomyoma. (Left) The axial CE imaging shows that the ablated necrotic lesion is observed as non-enhancing hypointense zones (star), and surrounding residual leiomyoma appeared to be an enhancing hyperintense zone (arrow). (Middle) The corresponding axial SWI shows that the ablated necrotic lesion (star) signal intensity is similar to residual leiomyoma (arrow). (Right) The sketch map illustrates the extent of the ablated lesion (black area) and residual leiomyoma (white area).
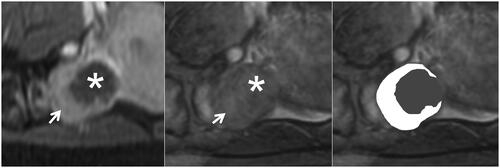
Figure 3. The complete hypointense peripheral rim on SWI. The left, Middle, and right figures are the CE, SWI imaging, and SWI sketch of the same leiomyoma. (Left) The axial CE imaging shows the range of ablated necrotic lesions, which appear as a non-enhancing hypointense zone (star). (Middle) The corresponding axial SWI shows a complete hypointense peripheral rim (arrow). (Right) The sketch map illustrates the range of the hypointense peripheral rim (black line); it involves ≥90% of the circumference of the ablated zone.
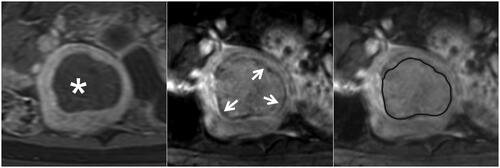
Figure 4. The partial hypointense peripheral rim on SWI. The left, Middle, and right figures are the CE, SWI imaging, and SWI sketch of the same leiomyoma. (Left) The axial CE imaging shows the range of ablated necrotic lesions, which appear as a non-enhancing hypointense zone (star). (Middle) the corresponding axial SWI shows a partial hypointense peripheral rim (arrow). (Right) The sketch map illustrates the range of the hypointense peripheral rim (black line); it involves 50%–90% of the circumference of the ablated zone.
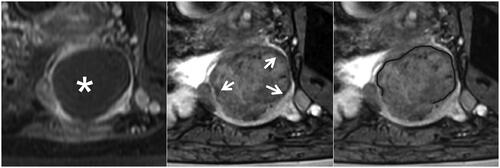
Figure 5. The partial hypointense peripheral rim on SWI. The left, middle, and right figures are the CE, SWI imaging, and SWI sketch of the same leiomyoma. (Left) The axial CE imaging shows the range of ablated necrotic lesions, which appear as a non-enhancing hypointense zone (star). (Middle) the corresponding axial SWI shows an absent hypointense peripheral rim (arrow). (Right) the sketch map illustrates the range of the hypointense peripheral rim (black line); it is non-continuous and involves less than 50% of the circumference of the ablated zone.
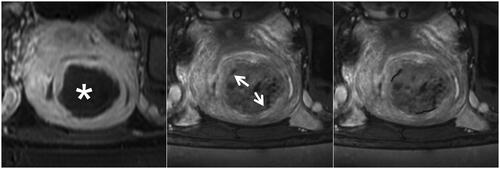
Table 2. SWI characteristics of lesions after MRgFUS ablation.
Table 3. Relationship between characteristic of SWI and NPV ratio groups.
Table 4. Diagnostic value of a hypointense peripheral rim to NPV ratio ≥ 90% (n = 27).
Data availability statement
Patient data cannot be publicly shared because of the national legislature on patient data. But the data used to support the findings of this study are available from the corresponding author upon request.