Figures & data
Figure 1. Survival curves for the two cell lines after LDR, PDR and HDR irradiations. Cell lines and radiation protocols are indicated on the figure key. All figures are fitted using the LQ model and the error bars are the standard error of the mean of three experiments. Student's t-test determined that the differences between matched PDR and LDR doses are not statistically significant at the 95% confidence level for either cell line, while for HDR they were significantly different.
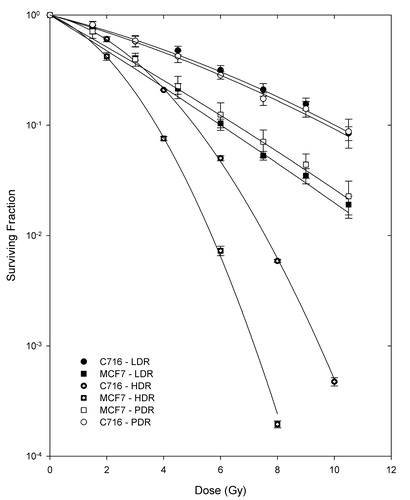
Figure 2. Survival curves for the MCF7 cell line after pulsed dose rate with/without hyperthermia (PDR/PDRH), low dose rate with/without hyperthermia (LDR/LDRH) and high dose rate (HDR) irradiation. Student's t-test determined that the differences between matched PDRH and LDRH doses are not statistically significant at the 95% confidence level. Differences between PDR and PDRH as well as LDR and LDRH matched doses are significant at 6 Gy and higher.
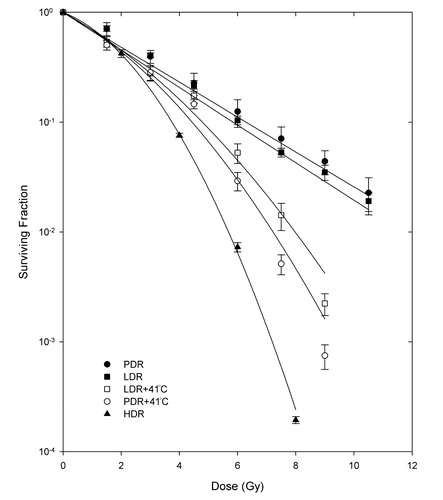
Figure 3. Survival curves for the C716 cell line after pulsed dose rate with/without hyperthermia (PDR/PDRH), low dose rate with/without hyperthermia (LDR/LDRH) and high dose rate (HDR) irradiation. Student's t-test determined that the differences between matched PDRH and LDRH doses are not statistically significant at the 95% confidence level. Differences between PDR and PDRH as well as LDR and LDRH matched doses are significant at 4.5 Gy and higher.
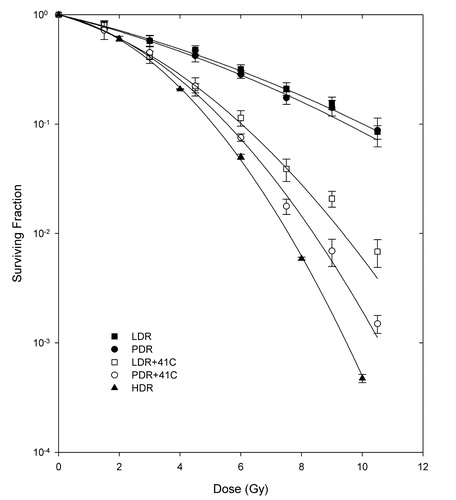
Figure 4. Tail moments normalized to unirradiated controls following LDR and PDR irradiation with/without hyperthermia for the MCF7 cell line. Student's t-test determined that the differences between matched PDRH and LDRH doses are not statistically significant at the 95% confidence level. Differences between PDR and PDRH as well as LDR and LDRH matched doses are significant when combining the PDR and LDR data vs. PDRH and LDRH data.
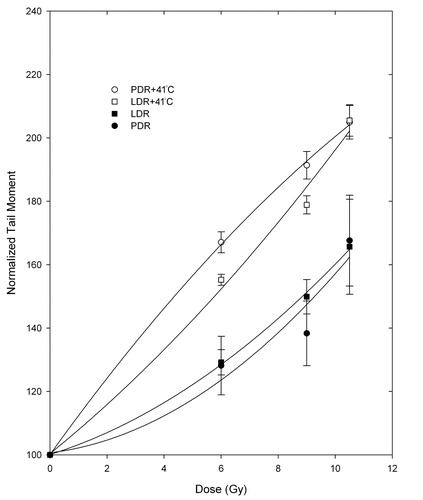
Figure 5. Tail moments normalized to unirradiated controls following LDR and PDR irradiation with/without hyperthermia for the C716 cell line. Student's t-test determined that the differences between matched PDRH and LDRH doses are not statistically significant at the 95% confidence level. Differences between PDR and PDRH as well as LDR and LDRH matched doses are significant when combining the PDR and LDR data vs. PDRH and LDRH data.
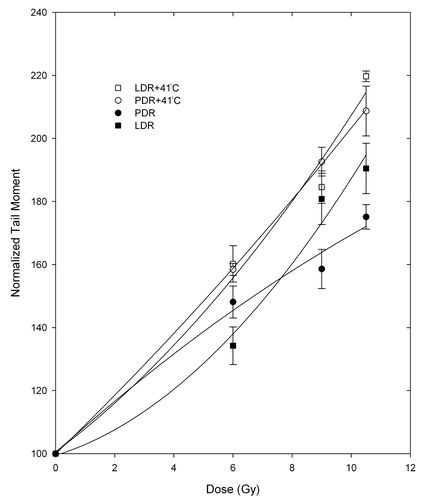
Figure 6. Normalized CP ratios for the β polymerase levels of expression following LDR and PDR irradiation for the MCF7 and C716 cell lines. Student's t-test determined that the differences between matched PDR and LDR doses, as well as LDR and PDR untreated vs. treated dose points are not statistically significant at the 95% confidence level for either cell line.
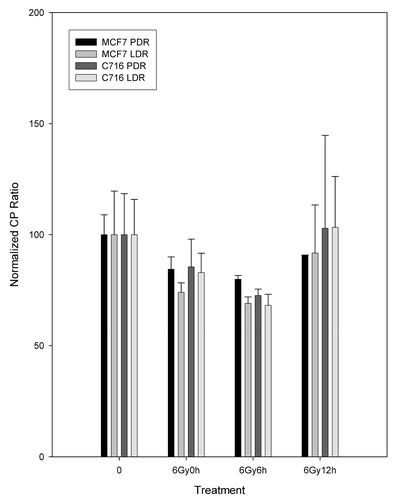
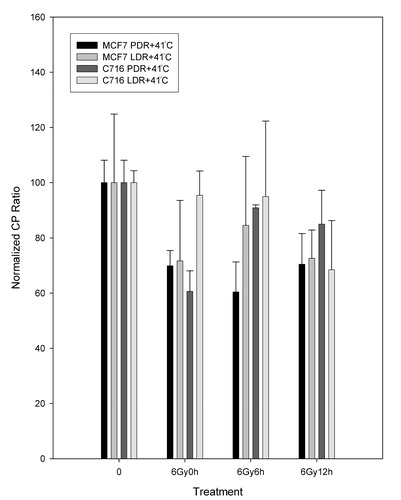
Figure 7. Normalized CP ratios for the β polymerase levels of expression following LDR and PDR irradiation with hyperthermia (LDRH and PDRH) for the MCF7 and C716 cell lines. Student's t-test determined that the differences between matched PDRH and LDRH doses, as well as LDRH untreated vs treated dose points are not statistically significant at the 95% confidence level for either cell line. Significant differences were found for the PDRH untreated vs. 6 Gy at 0 h and 6 Gy after 6 h data points for the MCF7 cell line and PDRH untreated vs. 6 h at 0 h data points for the C716 cell line.