Figures & data
Table 1. Mean goals in 7 football leagues within about 6 years before and about 7 years after the introduction of the 3pfaw rule.
Table 2. Results from tests of equality between mean goals before and after the 3pfaw.
Table 3. Proportions of decided matches in 7 football leagues within about 6 years before and 7 years after the 3pfaw rule.
Table 4. Results from tests of associations between the 3pfaw rule and match outcomes.
Table 5. Posterior estimates from the analysis of mean goals.
Table 6. Posterior probabilities and Bayes Factors for changes in mean goals.
Table 7. Posterior estimates from the analysis of proportions of decided matches.
Table 8. Posterior probabilities and Bayes Factors for changes in proportions of decided matches.
Table 9. Results (in log-scales) from Shiryaev–Roberts change point detection tests.
Figure A1. Trends in mean goals before and after introduction of 3pfaw rule across seven leagues.
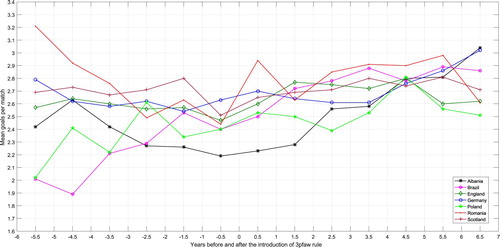
Figure A2. Trends in proportions of decided matches before and after introduction of the 3pfaw rule across seven leagues.
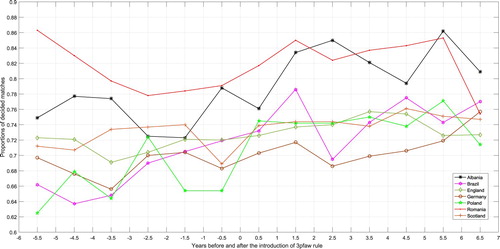
Figure A3. Posterior distributions of mean goals before and after the 3pfaw rule in seven leagues (a–g), change-points (h), and differences in mean goals (i).
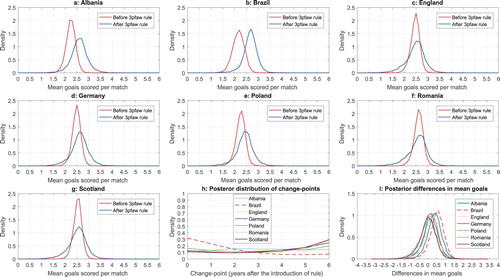
Figure A4. Posterior distributions of proportions of decided matches before and after the 3pfaw rule (a–g), change-points (h), and differences in proportions (i).
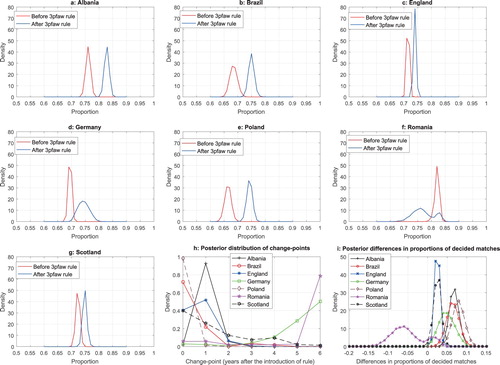
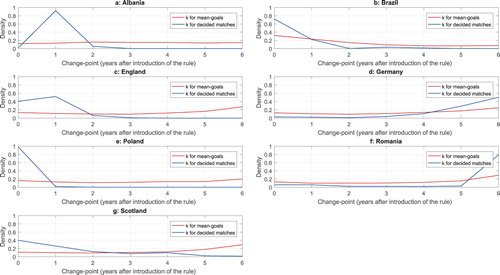
Figure A5. Posterior distributions of change-points (k) for mean-goals (red) and proportions of decided matches (blue) across the seven leagues studied.