
Figures & data
Figure 1. Poi-INAR(1) DGP with ,
, and sample size T. Distribution of forecasts conditioned on value 5: conditional median (‘PF
’, true value: 5), 95%-quantile (‘PF
’, true value: 8), and limits l, u of 90%-PI (‘PI
’, true limits: 2, 8). Distribution under estimation uncertainty as gray dots, and boxplots of resampled distributions.
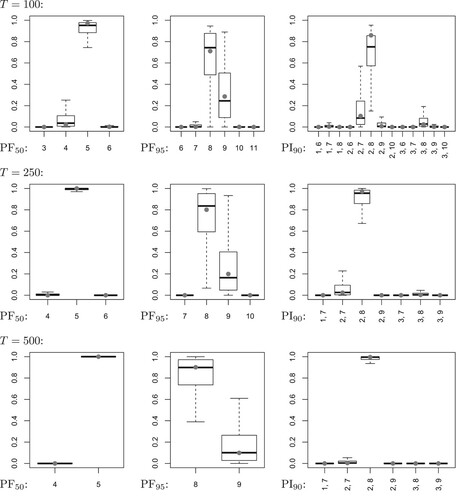
Figure 2. Poi-INAR(1) DGP with ,
, and sample size T. Distribution of forecasts conditioned on value 5: conditional median (‘PF
’, true value: 5), 95%-quantile (‘PF
’, true value: 7), and limits l, u of 90%-PI (‘PI
’, true limits: 3, 7). Distribution under estimation uncertainty as gray dots, and boxplots of resampled distributions.
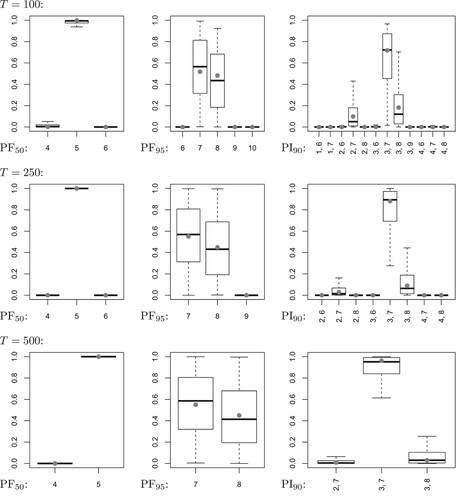
Figure 3. Strikes counts discussed in Section 4: time series plot (left) and sample ACF with time lag k (right).
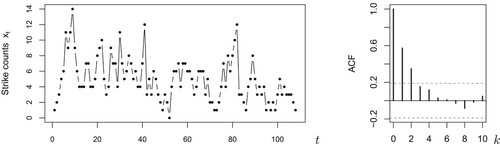
Figure 4. Strikes counts in 2003 (solid line) together with different types of forecasts: conditional median (“PF”), 95%-quantile (“PF
”), and 90%-PI (“PI
”), computed from ML-estimated parameter (upper panel) or based on resampled ML-estimates (lower panel).
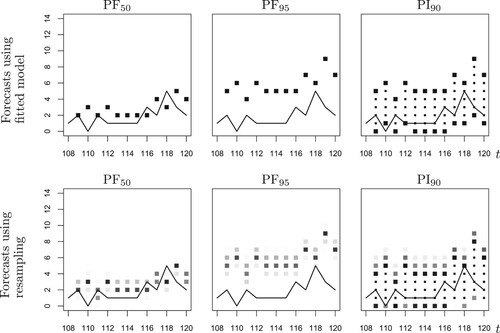
Figure 5. Forecast PMFs for strikes counts in Jan./Feb. 2003, computed from ML-estimated parameter (grey line) or based on resampled ML-estimates (box plots).
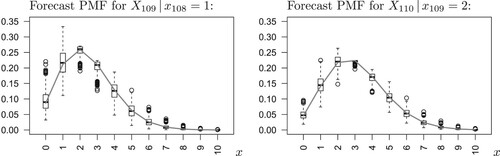
Table A1. Coherent forecasting of Poi-INAR(1) DGP: conditional median (‘PF’), 95%-quantile (‘PF
’), and 90%-PI (‘PI
’), computed from true parameter, ML-estimated parameter, or based on resampled ML-estimates.
Table A2. Coherent forecasting of Poi-INAR(1) DGP based on resampled ML-estimates: conditional median (‘PF’), 95%-quantile (‘PF
’), and 90%-PI (‘PI
’). Mean number of different forecasts obtained from resampling.
Table A3. Coherent forecasting of different count DGPs: conditional median (‘PF’), 95%-quantile (‘PF
’), and 90%-PI (‘PI
’), computed from true parameter, ML-estimated parameter, or based on resampled ML-estimates. Numbers of agreement of true and estimated forecasts.
Table A4. Coherent forecasting of different count DGPs: conditional median (‘PF’), 95%-quantile (‘PF
’), and 90%-PI (‘PI
’), computed from true parameter, ML-estimated parameter, or based on resampled ML-estimates. Numbers of agreement of estimated forecasts and modes of resampled forecasts.
Table A5. Coherent forecasting of different count DGPs: conditional median (‘PF’), 95%-quantile (‘PF
’), and 90%-PI (‘PI
’), computed from true parameter, ML-estimated parameter, or based on resampled ML-estimates. Numbers of cases, where true forecasts covered by resampled forecasts.
Table A6. Coherent forecasting of different count DGPs: conditional median (‘PF’), 95%-quantile (‘PF
’), and 90%-PI (‘PI
’), computed from true parameter, ML-estimated parameter, or based on resampled ML-estimates. Mean lengths of support of resampled forecasts.