
Figures & data
Table 1. P-values of tests for the gene expressions (GE) dataset of Section 4 with p = 3 and n = 24.
Table 2. Simulation A: Empirical rejection frequencies (in ).
Table 3. Simulation B: Empirical rejection frequencies (in ).
Figure 1. Simulation C: empirical rejection rates for the permutation test of bivariate symmetry for variables 1 and 3 (left), and for the multivariate permutation test using the approach of Fisher (middle) and Tippett (right). The curves correspond to (1) Hollander (stars), (2) LR (circles), (3) rank test of Snijders (squares), (4) sign test (triangles), (5) NN test (diamonds), and (6) ID-rank test (plus signs).
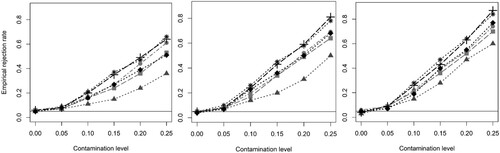
Table 4. Simulation D: Empirical rejection frequencies (in ).
Table 5. Simulation E: Empirical rejection frequencies (in ).