Figures & data
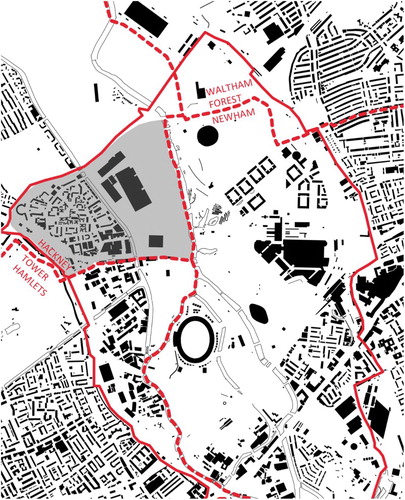
Figure 1. Lower Lea Valley 'Opportunity Area' (grey tone) and local authority boundaries (red, dashed lines).
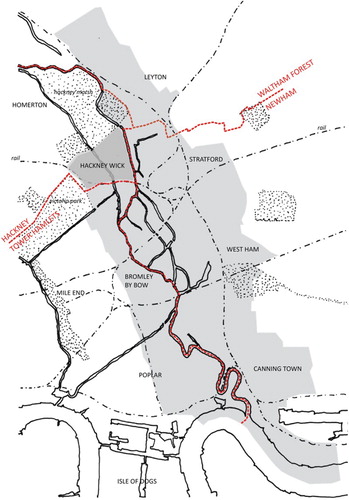
Figure 2. Hackney Wick in the context of significant boundaries in 1870.
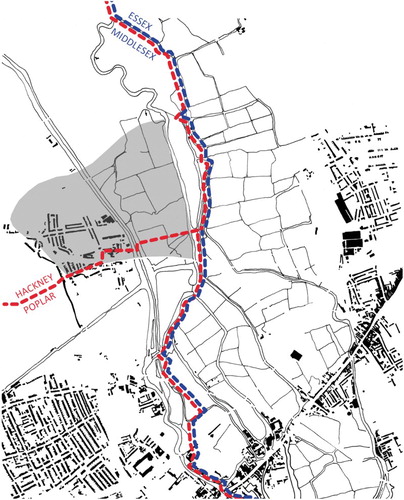
Figure 3. Hackney Wick in the context of significant boundaries in 1915.
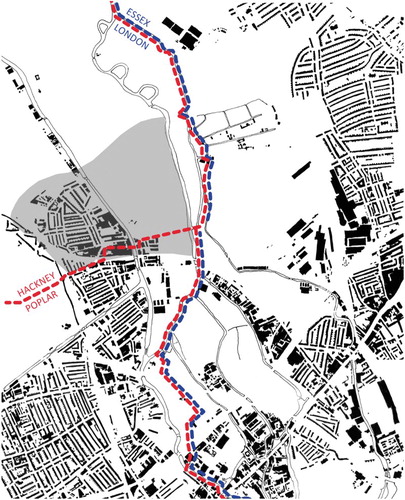
Figure 4. Map locating streets in Hackney Wick, 1890s.
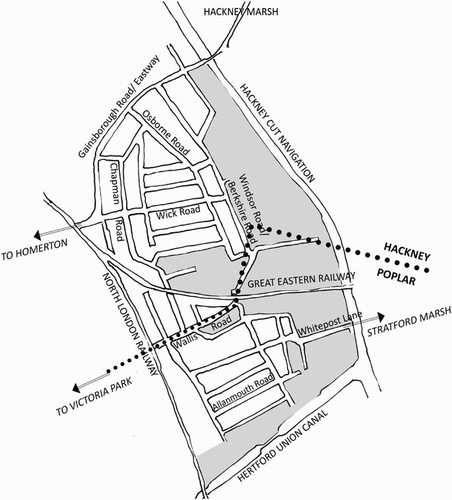
Figure 5. The Eton Mission Church.
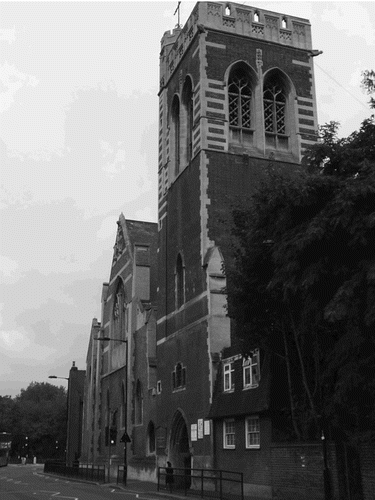
Figure 6. Aerial view of Hackney Wick, 1924 © [Historic England, Aerofilms Collection].
![Figure 6. Aerial view of Hackney Wick, 1924 © [Historic England, Aerofilms Collection].](/cms/asset/12eadf5c-4553-49a0-a097-a11bbb0acd36/rppe_a_1127180_f0006_b.gif)
Figure 7. Bombed housing in Hackney Wick, 1941 © [Hackney Archives].
![Figure 7. Bombed housing in Hackney Wick, 1941 © [Hackney Archives].](/cms/asset/3c443203-69b1-46a0-bc75-f0e714589b4d/rppe_a_1127180_f0007_b.gif)
Figure 8. Hackney Wick in the context of significant boundaries in 1950.
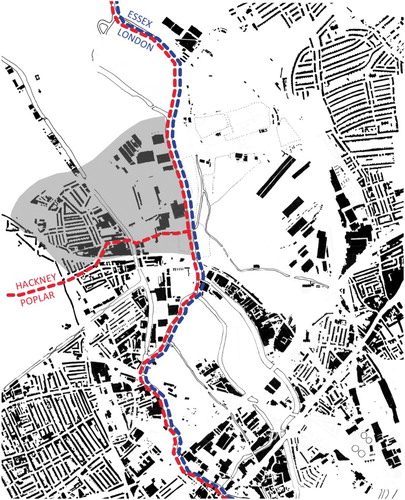
Figure 9. Hackney Wick in the context of significant boundaries in 1970.
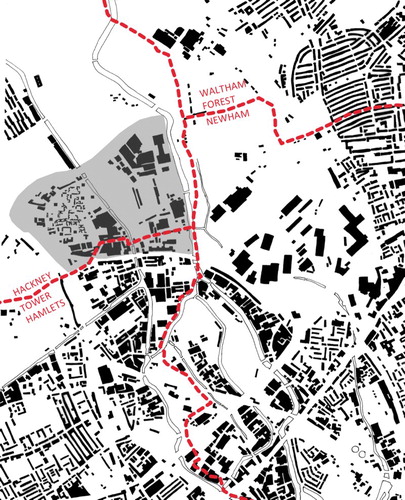
Figure 10. Aerial view of the Trowbridge Estate, 1970s © [Historic England, Aerofilms Collection].
![Figure 10. Aerial view of the Trowbridge Estate, 1970s © [Historic England, Aerofilms Collection].](/cms/asset/9351ed1f-4c2d-4758-b23f-8d48977fb936/rppe_a_1127180_f0010_b.gif)
Figure 11. Makeshift industrial development and the Trowbridge Estate, 1970s © [Hackney Archives].
![Figure 11. Makeshift industrial development and the Trowbridge Estate, 1970s © [Hackney Archives].](/cms/asset/920442d8-ad33-4df4-acfb-6a4bf0745a48/rppe_a_1127180_f0011_b.gif)
Figure 12. Patio houses of the Trowbridge Estate.
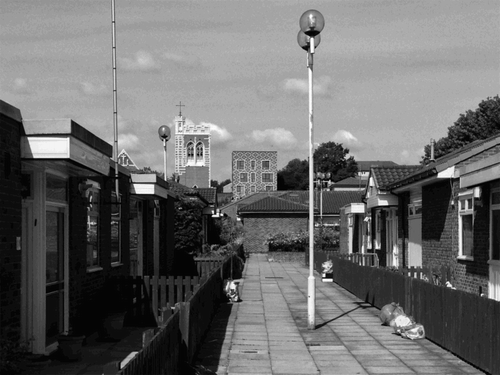
Figure 13. Hackney Wick in the context of significant boundaries in 2007.
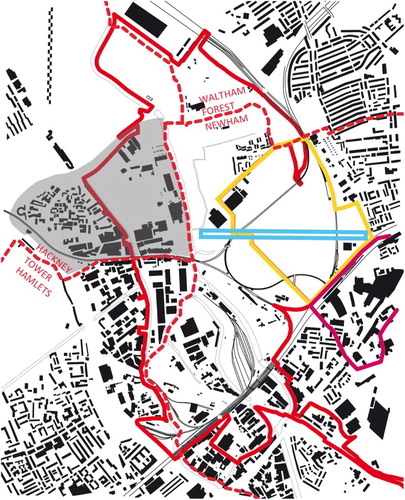
Figure 14. View from Hackney Wick Station.
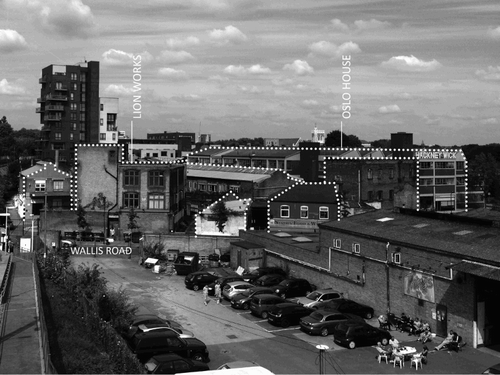
Figure 15. Hackney Wick in the context of significant boundaries in 2015.