Figures & data
Figure 1. Road traffic by vehicle type (excl. cars) Great Britain 1949–2009. Source: Department for Transport, Transport Statistics.
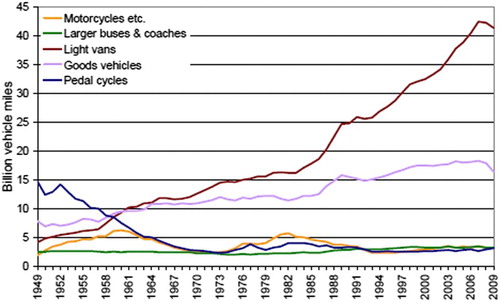
Figure 2. ‘Getting around’, the benefits of the bicycle. Source: Cyclists’ Touring Club (1957: 91).
Figure 3. Stevenage cycleway underpass at road junction. Source: http://www.roadswerenotbuiltforcars.com/stevenage/, last accessed 4 April 2017.
Figure 4. The Buchanan Report’s much reproduced ‘vision of the future’. Source: Colin Buchanan, Traffic in Towns, 143.
Figure 5. ‘Trail of the modern improvement devil’. Source: Cyclists’ Touring Club, The CTC Gazette, 1961, 23.
Figure 6. Perceived future of the automobile-age. Source: Cyclists’ Touring Club, The CTC Gazette, 1963, 81.
Figure 7. Automobile Association’s Safety Through Courtesy booklet. Source: Cyclists’ Touring Club, The CTC Gazette, 1952, 645.
Figure 8. RoSPA poster. Source: Cyclists’ Touring Club, The CTC Gazette, 1959, 207.