Figures & data
Figure 1. Iranian technocratic elite at Plan Organization. Source: Historical Review of Second Development Plan. Archive of British Library.
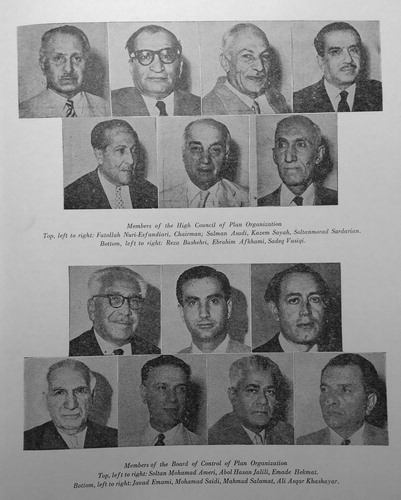
Figure 2. Abolhassan Ebtehaj, director of Plan Organisation. Source: Historical Review of Second Development Plan.
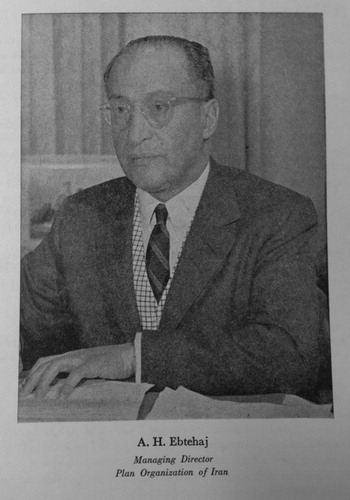
Table 1. List of urbanization projects of Second Development Plan (1955–1962) and the list of rural development projects.
Figure 3. Shows the rapid urban expansion of Tehran from 1950 to 1960. Source: Drawn by author, compiled from: Tehran urban growth map in 1970, published in Cultural Atlas of Tehran (see bibliography).
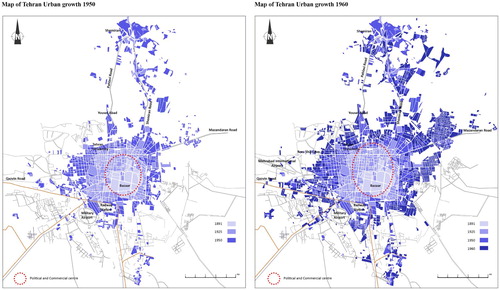
Figure 4. The list of approved Master Plans in 1971. Source: Secretariat, High Council for Urban Planning, Ministry of Housing and Development, Published in World Bank Report in 1972, ‘A Program of Reinvestment Studies in Iran’ – Report No. SA-28a.
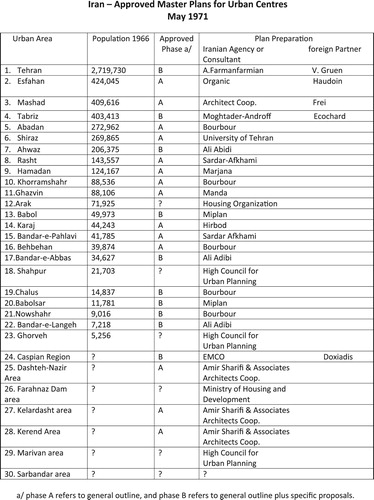
Figure 5. Diagram (A) shows the existing pattern of growth in Tehran in 1960, and Diagram (B) shows the proposed strategy of Tehran masterplan in 1966. Source (A): ‘Die Entwicklung der Stadt Tehran’ (Tehran Urban Development), Peter George Ahrens: 82. Source (B): Art and Architecture Magazine, No. 5. special issue of Tehran Comprehensive Plan, 1970.
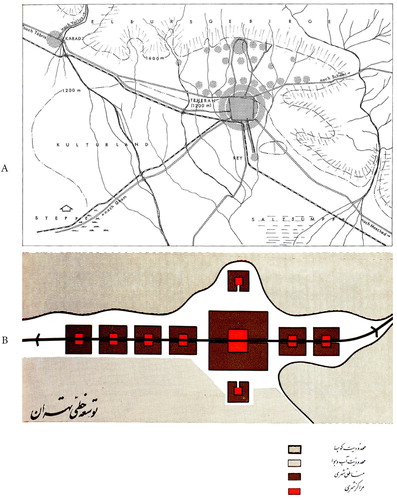
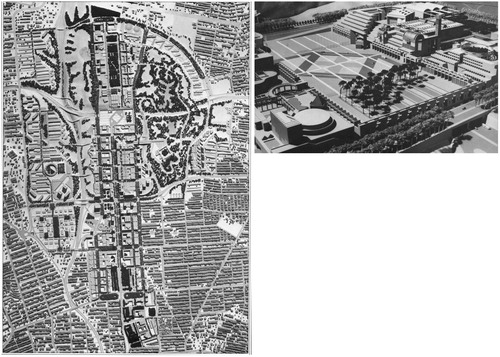
Figure 6. The scheme of Tehran Comprehensive Plan, projecting the ideal model of Tehran expansion towards the west, Source: TCP report 1966, Tehran Municipality.
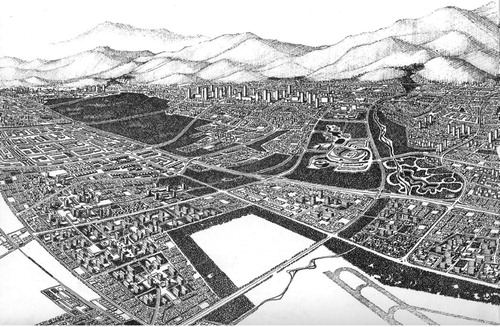
Figure 7. Different neighborhood unit schemes proposed by Tehran Comprehensive Plan for different income groups. Source: Drawn by author, compiled from Art and Architecture Magazine, No. 5. special issue of Tehran Comprehensive Plan, 1970.
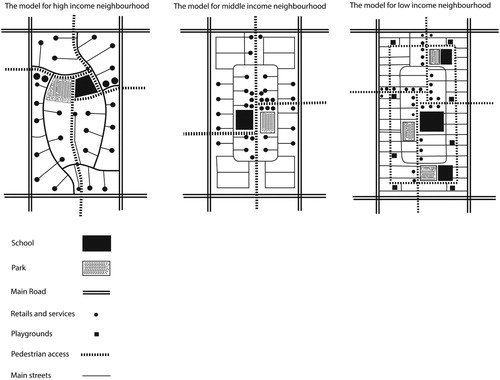
Figure 8. Tehran urban expansion in 1974. Source: Drawn by author, compiled from Map of Tehran in 1974, published in Cultural Atlas of Tehran, 1976.
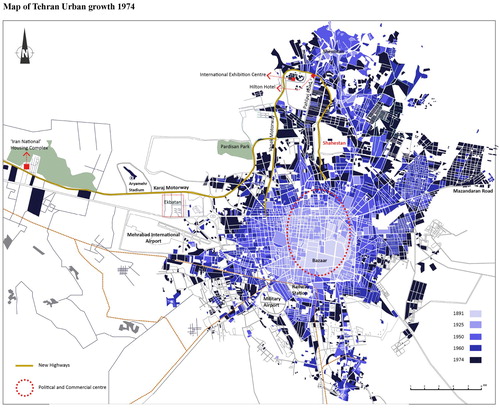
Figure 9. Scheme and model of ‘Iran National’ housing complex (Peykan Shahr), 1972. Source: Art and Architecture magazine, 1972, vol. 12–13, page 117–119.
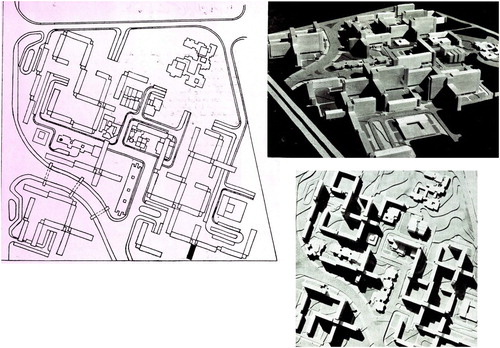
Figure 10. Top image shows the areal photo of Ekbatan mass housing project. Source: DSH Design Group, http://wp.dshdesigngroup.com/ekbatan/ (accessed 14 October 2015).
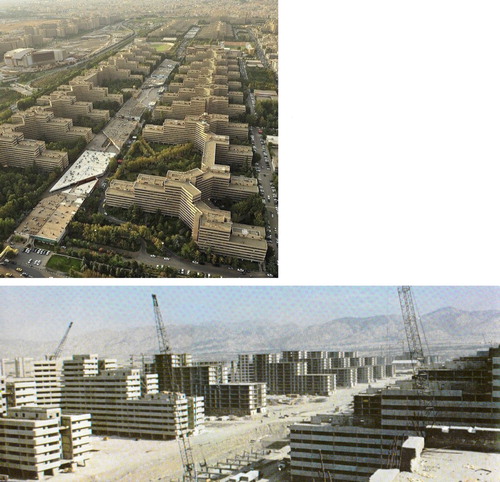
Figure 11. On the left, the condition of housing in historic centre of Tehran. On the right, the back allies of Tehran bazaar. Source: Seger, ‘Tehran, Eine Stadgeographische Studie’ (Geographic studies of Tehran), 1978.
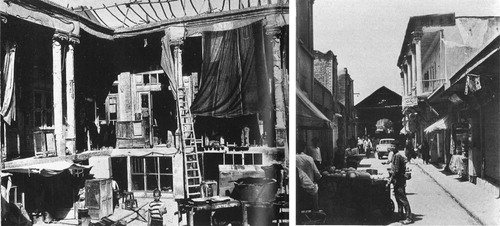
Figure 12. The Shahestan master plan on the right – on the top left design of the ‘Shah and Nation’ square. Source: Shahestan Pahlavi, a New City Centre for Tehran, Report by Liewelyn-Davies International, planning consultants, vol. 2. 1976.