Figures & data
Table 1. Architecture, construction and planning projects as part of Finnish-Tanzanian development cooperation, 1962–1988.
Table 2. Number of Finnish professionals in construction business working in bilateral development cooperation in Tanzania, 1970–1978, depicted both in terms of number of persons (above) and labour input in working months (below).
Table 3. This table compares the number of all Finnish-Tanzanian bilateral development cooperation projects with the proportion of architecture and planning projects quantified by year, following the categorization system in the Finnish development cooperation yearbooks.
Table 4. Number of ongoing planning projects per each year implemented as part of Finnish-Tanzanian development cooperation in 1962–1988 following the categorization system in .
Figure 1. Existing Land Use in 1973. Source: Moshi Master Plan 1974.
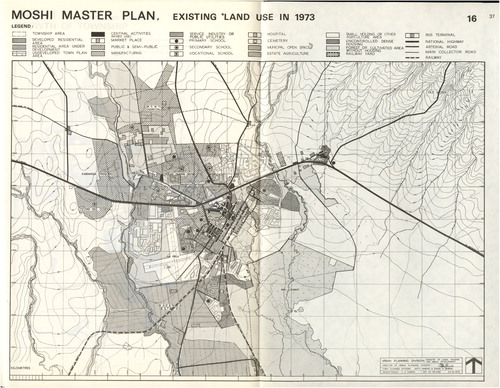
Figure 2. Land Use in 1994. Source: Moshi Master Plan 1974.
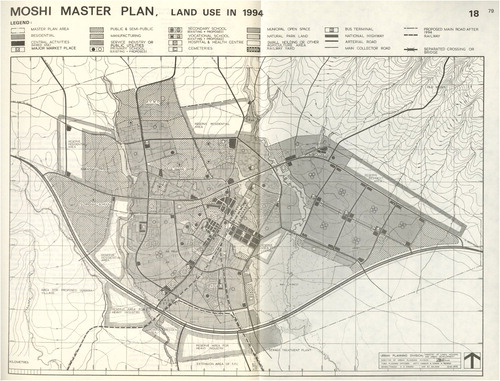
Figure 3. Relationship between Different Problems. Source: Lindi Regional Integrated Development Plan 1975.
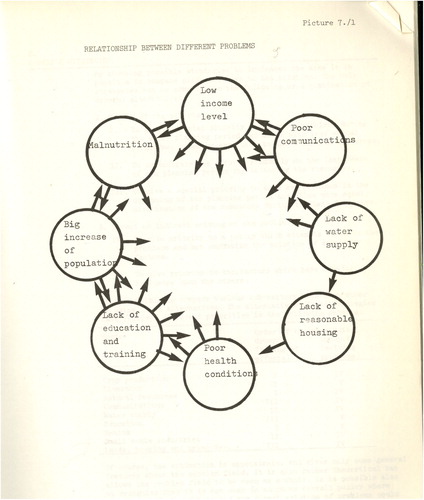
Figure 4. Projects on map. Source: Finnish Development Cooperation yearbooks 1972–1980. Supplemented by archival work in Ministry for Foreign Affairs of Finland Archive, 12 R Tansania. (Image: Essi Lamberg).
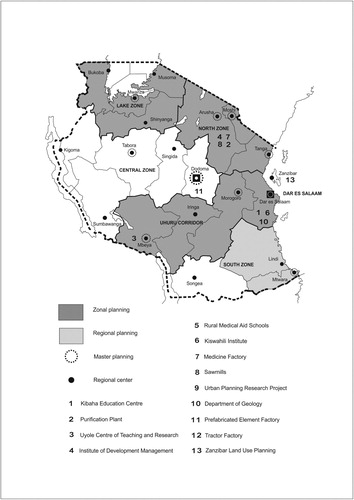
Figure 5. Internal Spatial Hierarchy of a Neighbourhood Unit Based on the TANU Ten Cell Unit. Source: Uhuru Corridor Regional Physical Plan 1975–1978. Main Report III Urban Land Use.
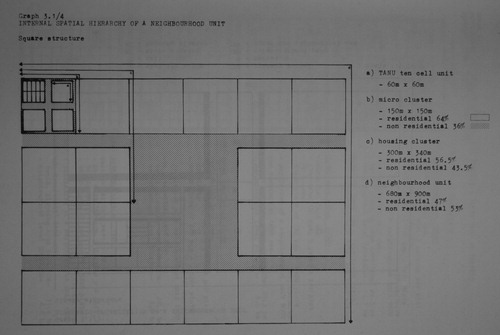
Figure 6. Schematic Organization of a Neighbourhood Unit. Source: Uhuru Corridor Regional Physical Plan 1975–1978. Main Report III Urban Land Use.
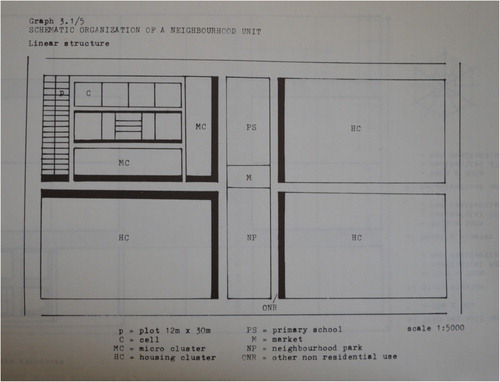
Figure 7. Ten-Cell System. Source: Tanga Master Plan 1974.
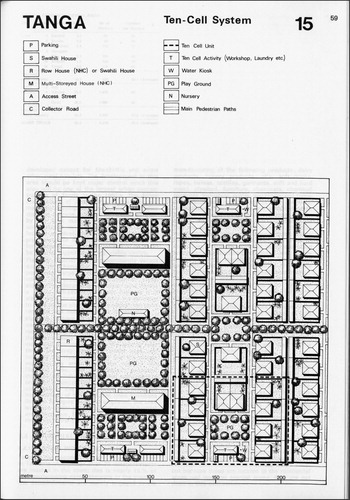
Figure 8. Community Concept – Schematic Organisation of Residential Units. Source: Lake Zone Regional Physical Plan, Main Report III: Urban Land Use.
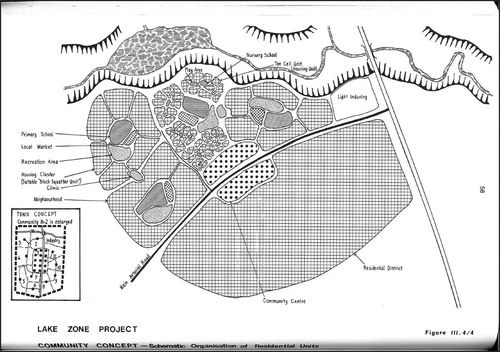
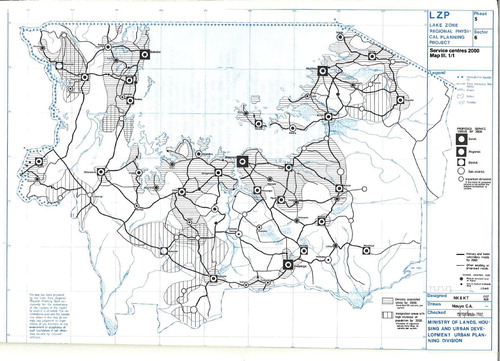
Figure 9. Service Centres 2000. Source: Lake Zone Regional Physical Plan, Main Report III: Urban Land Use.