Figures & data
Figure 1. Draft of Setúbal, Lisbon, Seixal and Arrentela location. Designed by the author.
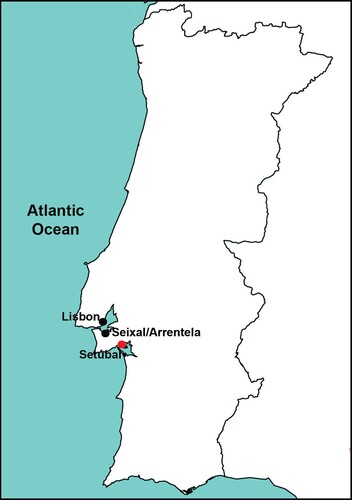
Figure 2. Draft of the Setúbal railway connections in the Portuguese railway network (19th–20th centuries). Source: CitationSilveira, Alves, Lima, Alcântara, and Puig, Population and Railways in Portugal, 72. Designed by the author.
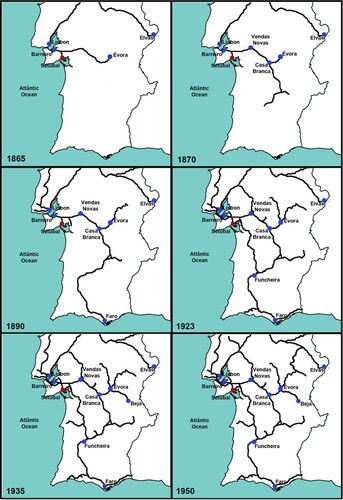
Figure 3. Draft of the port-rail infrastructure and urban growth of Setúbal in the current Municipal Territory. Red hatch: old port area (current fishing and recreational port area); yellow hatch: current industrial port area (a – Secil Terminal; b – other specialized port terminal facilities). Designed by the author.
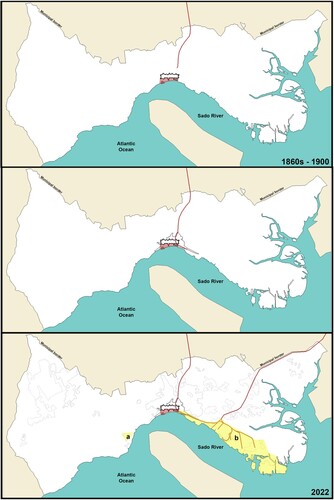
Figure 4. General layout of the Setúbal port developed by A. de M. Cid Perestrello in 1933. Source: Proceedings n. 588, Estação de Setúbal-Mar, Arquivo APSS. Adapted by the author.
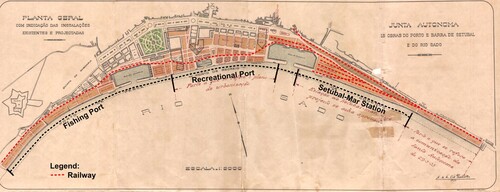
Figure 5. Draft of the railway connection between the port and Sado Line, 1934. Source: Annex in Proceedings n. 589-Pasta A, in Arquivo da APSS. Adapted by the author.
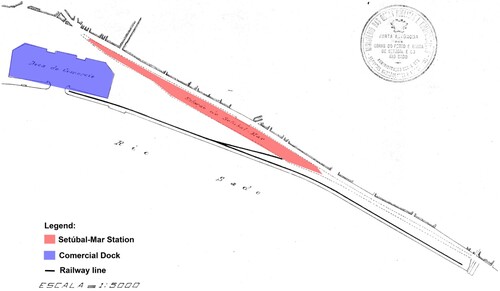
Table 1. Location of level-crossings. Source: Proceedings n. 588, in Arquivo APSS.
Table 2. The level-crossing proposed by the Autonomous Department. Source: Proceedings n. 588, in Arquivo APSS.
Figure 6. Topographical representation of Setúbal. Red: western waterfront; blue: eastern waterfront. Source: Seminário a Cidade e o Urbanismo | Município de Setúbal (mun-Setúbal.pt). Design by the author.
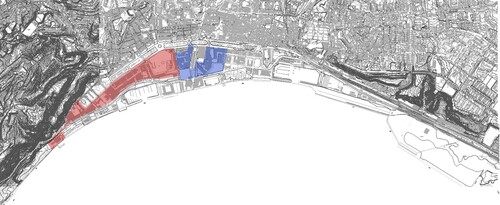
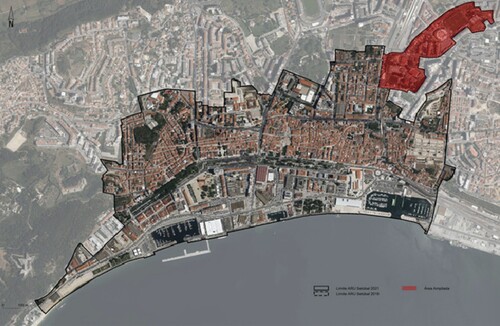
Figure 7. Representation of the Setúbal ARU overlap 2018 and 2021. Red: added area. Source: Diário da República, 2ª série, n. 74, p. 204.