Figures & data
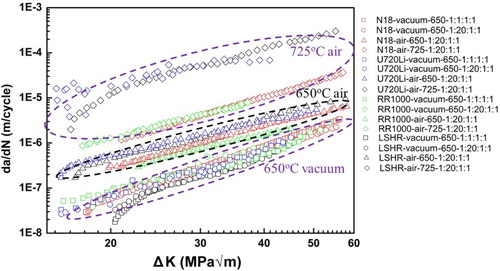
1 Fatigue crack propagation rates in four advanced turbine disc superalloys,Citation5,Citation9,Citation21,Citation22 where the figure legend indicates: alloy-environment-test temperature (in °C) – loading waveform (where 1:x:1:1 indicates a trapezoidal waveform: 1 second ramp up, x s at maximum load, 1 s ramp down and 1 second at minimum load).
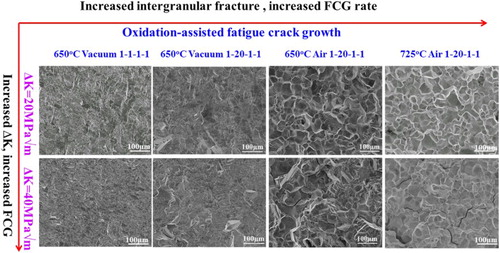
2 Fractography of supersolvus heat treated LSHR alloy tested in vacuum and air at 650 and 725°C using 1-1-1-1 and 1-20-1-1 loading waveform.Citation22