Figures & data
Figure 1. Schematic representation of the tensile test sample geometry (all dimensions are in mm). Both direction tensile specimens have the same dimensions.
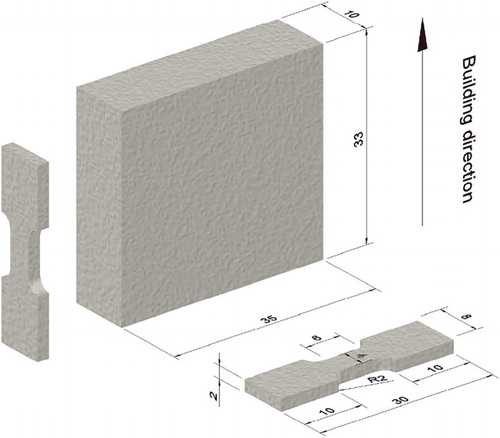
Table 1. Nominal chemical composition of the raw powder.
Figure 2. Schematic representation of the EBM samples. Hatch planes show the planes that were used to obtain EBSD data.
Table 2. EBSD image acquisition details.
Table 3. Single crystal elastic constants (units in GPa) of nickel-based superalloys and directional Young’s Modulus values (units in GPa).
Figure 3. Schematic representation of the boundary conditions used in OOF2 model.
Figure 4. EBSD invers pole figure colour maps from hatch region: (a) parallel to the build direction (BD), (b) normal to the build direction (BD), inverse pole figure maps for the EBSD image in (b).
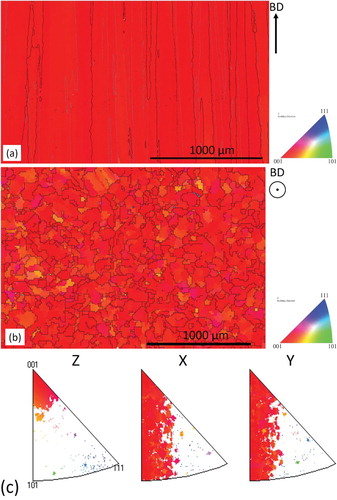
Table 4. Predicted Young’s Modulus.
Figure 5. Average Young’s Modulus from Experimental and Modelling work together with reported Young’s Modulus values of EBM Alloy 718 with columnar microstructure.
Table 5. Overall elastic stiffness matrix.
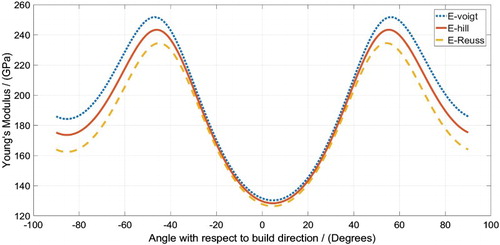
Figure 6. Young’s Modulus variation with respect to the build direction.