Figures & data
Table 1. Tenure distribution (%) in Flanders (2005) and the Netherlands (2006)
Table 2. Components of residual income in relation to the income of the tenant and the owner-occupier
Table 3. Components of residual income according to tenure for recent movers, average amounts in euro per month, Flanders/the Netherlands, 2005/2006
Table 4. Components of residual income according to tenure and tertiles of equivalent income for recent movers, average amounts in Euro per month, Flanders, 2005
Table 5. Components of residual income according to tenure and tertiles of equivalent income for recent movers, average amounts in Euro per month, the Netherlands, 2006
Table 6. User costs of housing according to tenure status and income, for households that moved during 10 recent years, average amounts in Euro per year, Flanders/the Netherlands, 2005/2006
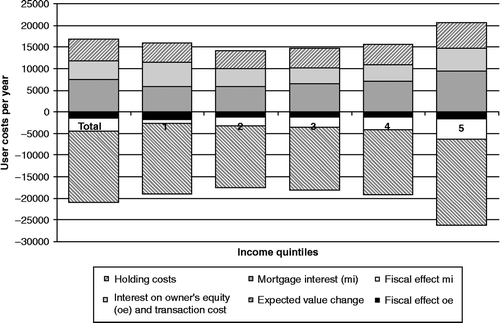
Figure 1 Composition of annual user costs (Euro) of Flemish owner-occupiers according to quintile of equivalent income, 2005. Source: Flemish Housing Survey (2005).
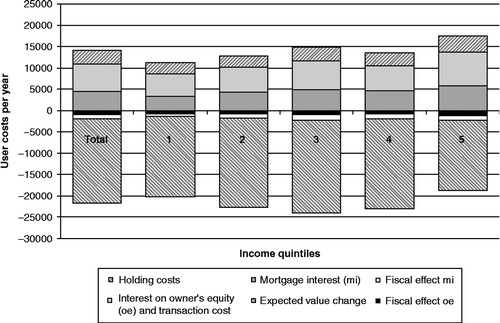
Figure 2 Composition of annual user costs (Euro) of Dutch owner-occupiers according to quintile of equivalent income, 2006. Source: WoON (2006), TU Delft/OTB calculations.