
Figures & data
Figure 1. Solo respondents’ current and ideal dwelling type (the number of rooms, kitchen excluded).
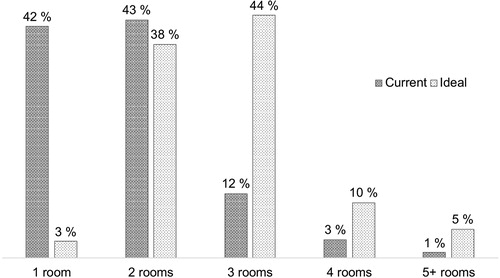
Figure 2. Solo respondents’ current and ideal apartment size (m2) in relation to net income (EUR/month).
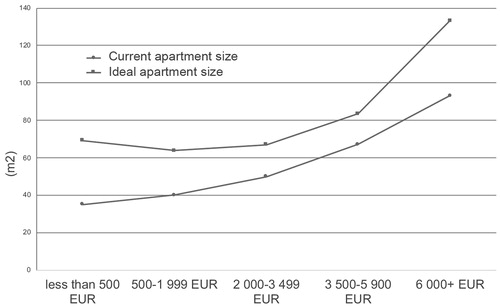
Figure 3. The experienced shortage of space based on solo respondents’ net income (EUR/month).
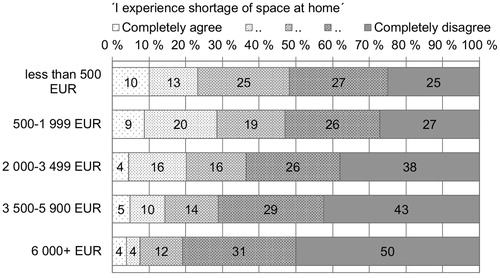
Table 1. Solo respondents’ current and ideal apartment sizes stated as number of rooms and square metres (m2).
Figure 4. The experienced shortage of space based on the solo respondents’ age.
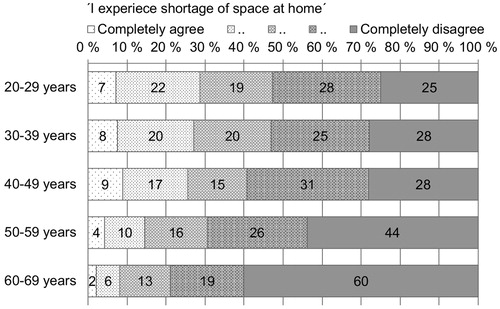
Figure 5. The experienced shortage of space in relation to solo respondents’ current apartment size.
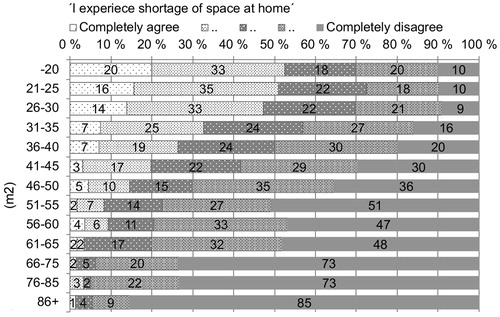
Figure 6. The share of solo respondents who experience a shortage of space in relation to dwelling density.
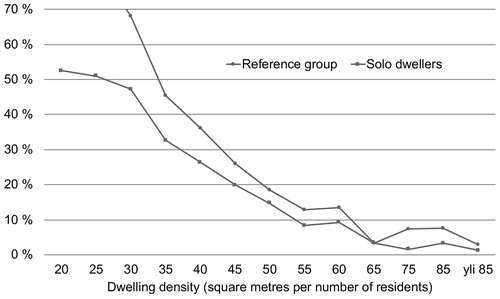
Figure 7. Solo respondents’ current and ideal kitchen types.
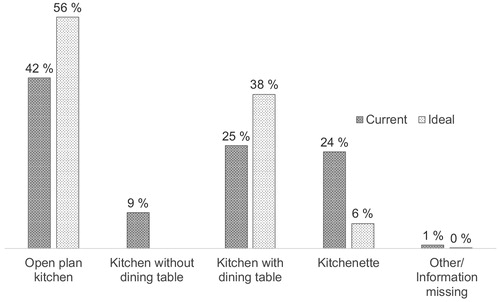
Figure 8. Floor plan diagrams of one-room apartments that illustrate the difference between kitchen types (open plan kitchen and separate kitchen).
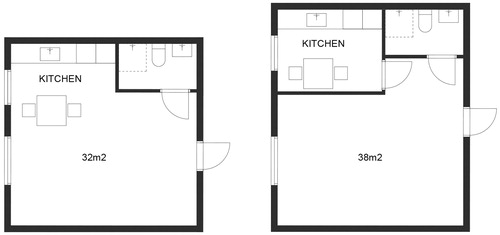
Figure 9. The most common apartment type in 1960–80s housing stock in Finland (According: Kaasalainen & Huuhka, Citation2016b, p. 279).
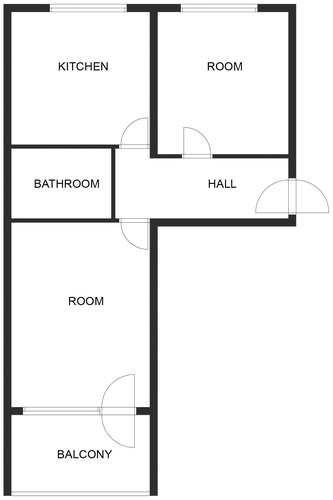
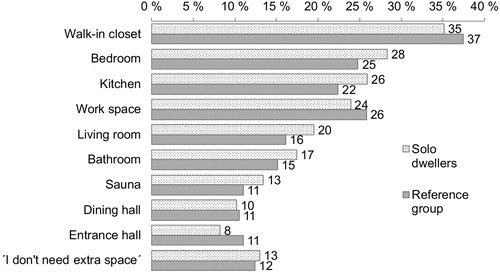
Figure 10. The use of ten extra square metres in relation to respondents’ current apartments.
Data availability statement
The data that support the findings of this study are available from the corresponding author [Anne Tervo] upon reasonable request.