
Figures & data
Figure 1. The inner city of Oslo and its surrounding suburbs.
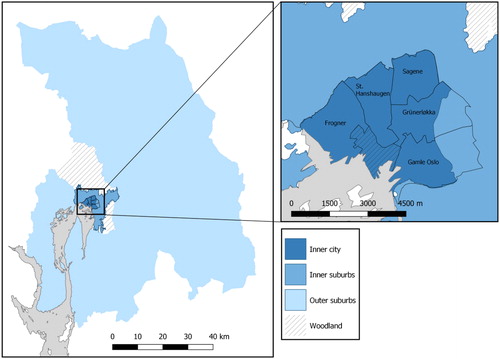
Table 1. Descriptive statistics: independent variables measured over ten years.
Figure 2. Continued residence in the inner city over 10 years: the Kaplan-Meier survival function, with 95% confidence intervals. Upper graph: Individuals who received their first child in 1995 and 2005, compared with two control groups. Lower graph: Individuals who received their first child in 1995 and 2005, divided by native/non-native background.
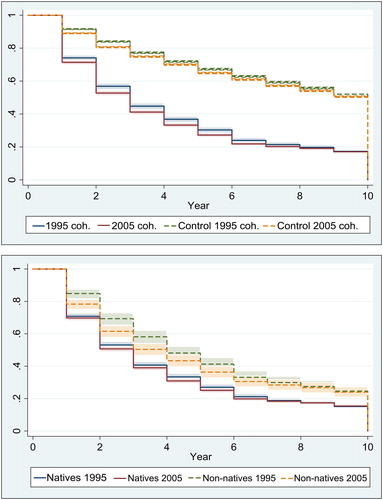
Table 2. Survival in the inner city as a function of individual and neighbourhood characteristics, based on a 10-years observation window.
Figure 3. Adjusted prediction of survival by cohort, native/non-native background, and average number of rooms per dwelling (census tracts) with 95% confidence intervals. Left graph: the 1995 cohort. Right graph: the 2005 cohort. Based on a logit model with all control variables ().
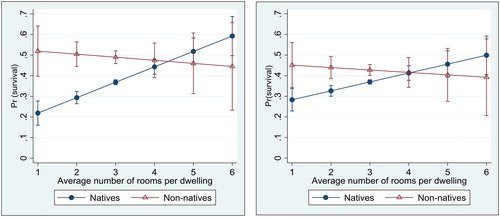
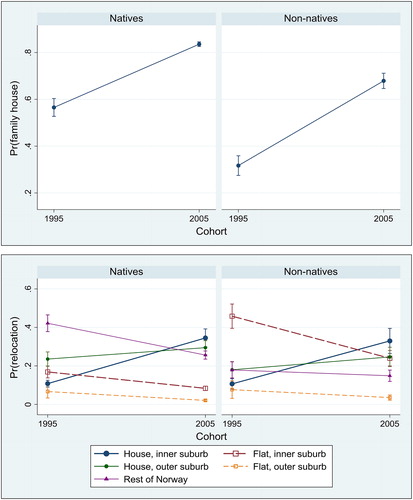
Figure 4. Adjusted prediction of relocation choices, with 95% confidence intervals. Upper graph: movement to a house by native/non-native background and cohort, based on a binary logit model. Lower graph: five choices by native/non-native background and cohort, based on a multinomial logit model. Control variables: age, gender, civil status, arrival of a second child, arrival of additional children, education, and log income.
Robustness checks.