Figures & data
Figure 1. Flows of pupils of highly educated parents attending schools out of their neighbourhood 2015. (Source: Cohen et al., Citation2016.).
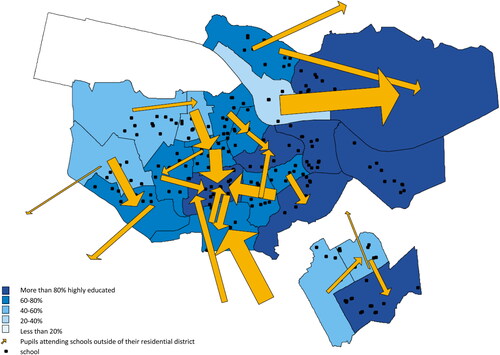
Figure 2. Distribution of groups of pupils across neighbourhood types 2008–2015. (Source: SSD; own calculations).
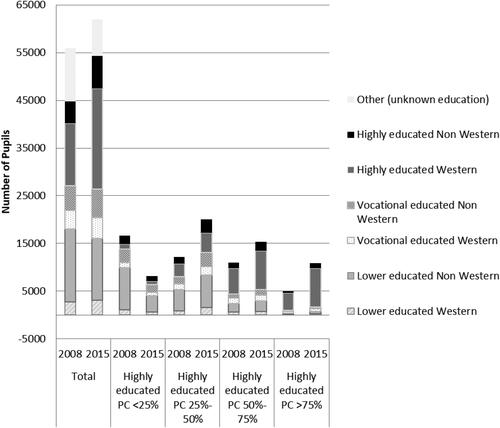
Figure 3. (a) Share of children in Amsterdam attending a school in their own neighbourhood (Source: SSD; own calculations). (b) Difference of share of children of highly educated and lower educated parents children who are attending a school in their own neighbourhood. (Source: SSD; own calculations).
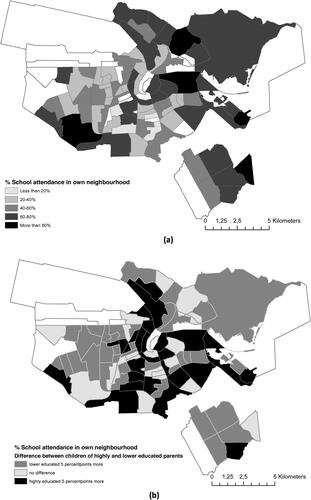
Figure 4. Share of children in different categories of schools in 2015, by different groups of parents (education/migration background) (Source: SSD; own calculations).
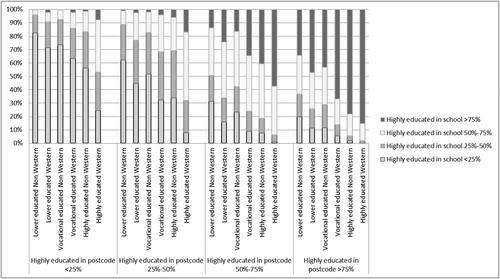
Figure 5. Share of children in different categories of schools based on the tracking into the highest levels, by different groups of parents (education/migration background) and neighbourhood composition (Source: SSD; own calculations).
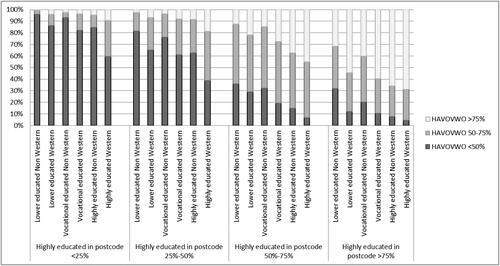
Figure 6. Predicted probabilities for the difference in highly educated in neighbourhood and school for the main independent variables: parental educational attainment and migration background.
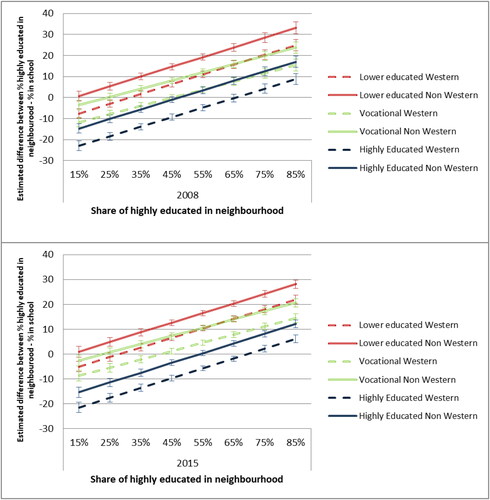
Table 1. Estimations of MEGLM models for the difference in the share of highly educated in the residential postal code and school (model 1) and the average share of advice for higher tracks (HAVO/VWO) of secondary education (model 2).
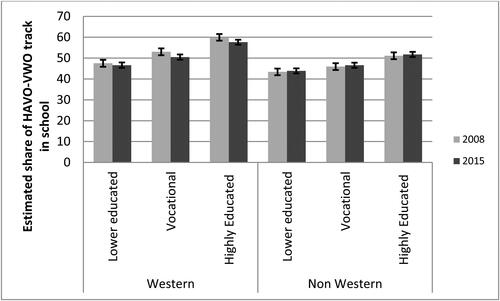
Figure 7. Predicted mean of share of advice for highest academic tracks at secondary education, by educational attainment and migration background.