
Figures & data
Table 1. Surveys from 1979 to 2015 in the Leipzig-Grünau LHE.
Figure 1. Feeling comfortable in the apartment and in the Leipzig-Grünau LHE 1979–2015 (Kabisch et al., Citation2016).
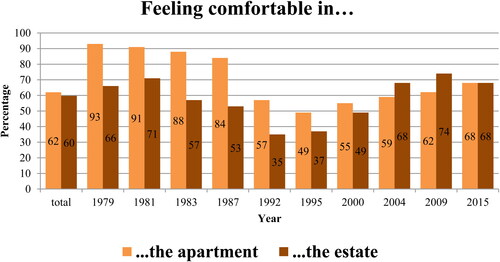
Table 2. Satisfaction with characteristics of the apartment (FC-apartment) and the estate (FC-estate) rated on a scale of 1 to 7, mean values (large values in bold, low values in italic, average values are not accentuated, sample sizes see in and ); the socio-demographic characteristics and distribution of the sample within the three parts of the estate are shown in percentages.
Table 3. ORs for the effects on FC-apartment.
Table 4. ORs for the effects on FC-estate.
Supplemental material