
Figures & data
Table 1. Categories of housing instability incidents based on three dimensions of residential mobility.
Figure 1. Mobility sequences of PSID sample households.
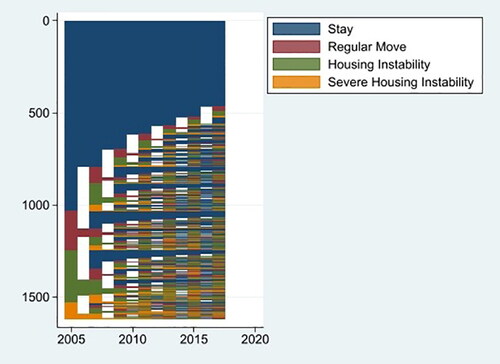
Table 2. Four types of residential trajectories among low-income households.
Table 3. The average numbers of housing instability statues from 2003 to 2017.
Table 4. Wave-to-wave transitions for all combinations of housing instability statuses at two different times.
Figure 2. A typology of mobility sequences.
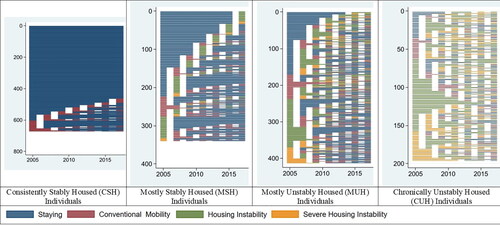
Table 5. Logistic Regression Results.