Figures & data
Figure 1. a. Map showing built-up area in Accra City Region (including GAMA) in 1985 and 2017.
Source: Asabere et al., (Citation2020)
b. Map of GAMA showing case study locations.
Source: Author’s own construct (2020).
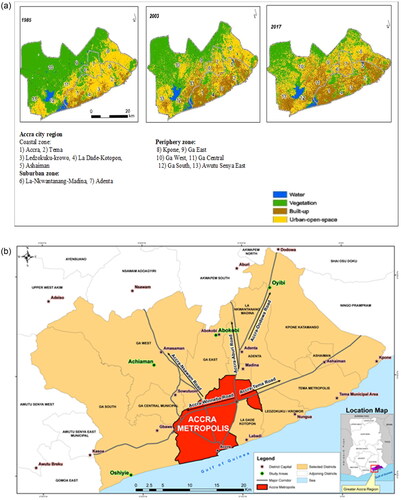
Table 1. Data on case study locations.
Table 2. Types of informal levies in peri-urban Accra.
Figure 2. A fence wall pulled down by Landguards.
Source: Fieldwork photo, 2018 (By Divine Asafo)
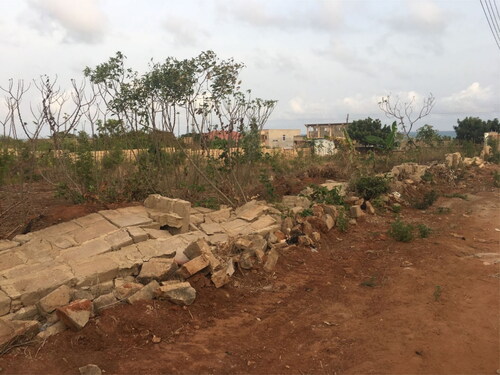
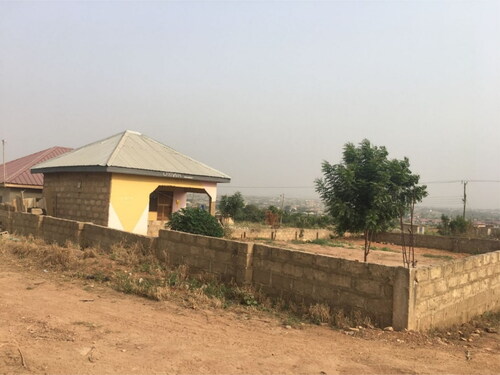
Figure 3. A compromised building built to protect the land /announce one’s physical presence on the land.
Source: Fieldwork photo, 2018 (by Divine Asafo)