Figures & data
Figure 1. Print screen of a choice set.
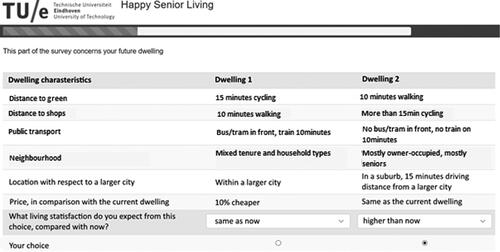
Table 1. Attributes and attribute levels.
Table 2. Description of the respondents.
Table 3. Decrease in fit of general model when delta parameters are omitted one attribute at a time.
Table 4. Decrease in fit of the constant shift model when delta parameters are omitted one attribute at a time.
Table 5. Estimation results.
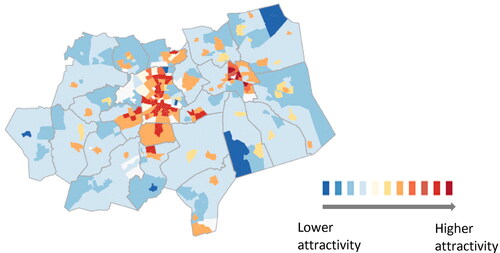
Figure 2. Neighbourhoods of Eindhoven region (Netherlands), predicted attractivity for seniors.