
Figures & data
Table 1. Descriptive statistics of accommodation sequences.
Figure 1. Example substitution operations.
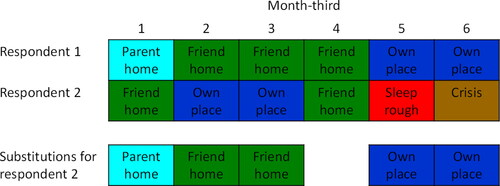
Figure 2. Dendrogram.
Dendrogram using Ward’s distance to cluster individuals. Only final stages of agglomerative clustering shown.
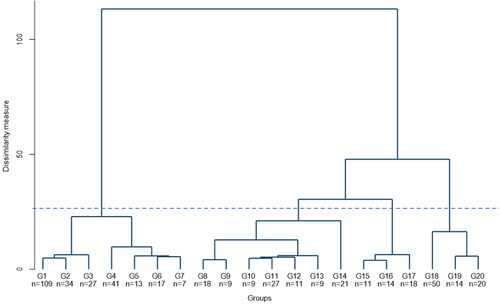
Figure 3. Typologies (Sequence index plot and chronographs).
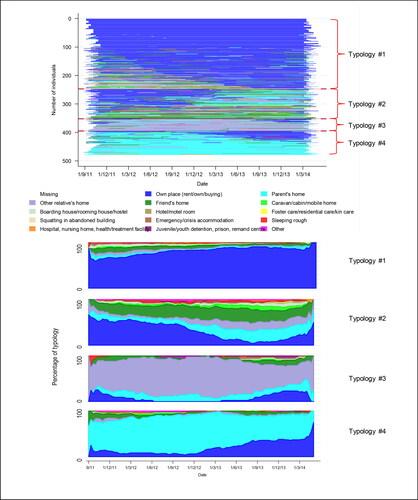
Table 2. Descriptive statistics of accommodation sequences, typology 1.
Table 3. Descriptive statistics of accommodation sequences, typology 2.
Table 4. Descriptive statistics of accommodation sequences, typology 3.
Table 5. Descriptive statistics of accommodation sequences, typology 4.
Table 6. Individual characteristics by typology.
Data availability statement
The Stata code is available for inclusion as supplemental material. The data can be accessed by authorized users following application to the National Centre for Longitudinal Data Dataverse at https://dataverse.ada.edu.au/dataverse/ncld.