Figures & data
Table 1. Forms of share housing in Australia.
Table 2. Characteristics of people seeking share accommodation via Flatmates, August 2020.
Table 3. Tenancy duration and weekly rent.
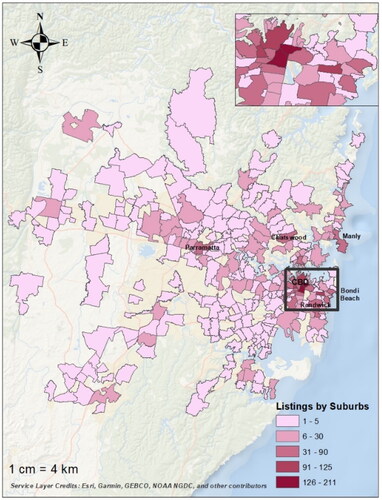
Map 1. Shared housing demand by Suburbs.
Source: Flatmates people’s listings Aug 2020.
Map 2. Shared housing supply by Suburbs.
Source: Flatmates accommodation listings Aug 2020.
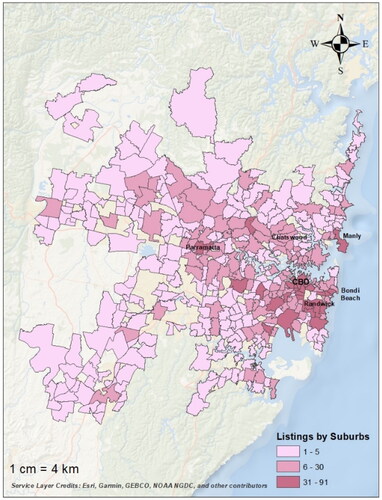
Table 4. Balance of share housing demand and supply in Sydney subregions.
Table 5. Share housing relative to formal housing stock (top suburbs of shared housing demand vs supply Aug 2020).
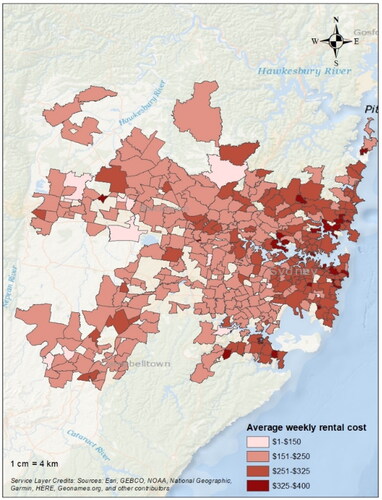
Map 3. Shared housing rental cost.
Source: Flatmates accommodation listings Aug 2020.
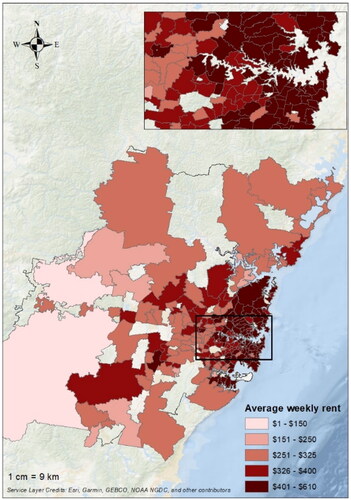
Map 4. Formal housing rental cost.
Source: Rental bonds data (up to one bedroom properties) Aug 2020.