
Figures & data
Figure 1. Housing tenure patterns in Turkey and Europe. Source: OECD (Citation2012)
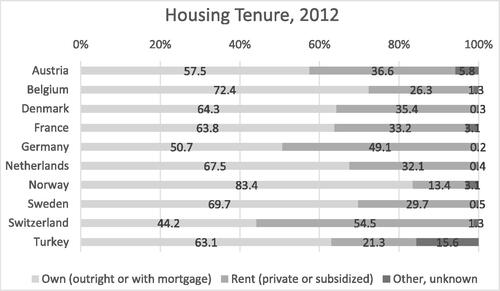
Table 1. Dependent, independent and control variables.
Table 2. Cross-tabulations with individual migration status.
Table 3. Housing tenure by migration status and country housing regime.
Table 4. Housing tenure by internal migration status of stayers in Turkey.
Table 5. Model 1: Multinomial estimations of housing tenure (N = 5688).
Table 6. Model 2: Multinomial estimations of housing tenure (N = 5695).
Table 7. Model 3: Dyadic multinomial estimations of housing tenure (N = 3295).
Table 8. Model 4: Dyadic multinomial estimations of housing tenure with interaction term (N = 3295).