0
Views
0
CrossRef citations to date
0
Altmetric
Research Article

A field experiment on ethnic bias in public housing practices in Sweden

ORCID Icon & ORCID Icon
Received 11 Aug 2023, Accepted 25 Jun 2024, Published online: 05 Jul 2024

Figures & data

Figure 1. Letter of inquiry.

Note: English translation of the two original letters of inquiry in Swedish sent from the fictitious couples to the public housing companies. The first version of the letter was used for all inquiries on January 18, 2022, and the second version was used for all inquiries on April 2, 2022. The names of the couples (marked red in the figure) were randomly assigned in the first stage of mailing and alternated in the second stage. In the second version of the letter, the actual name of a municipality (marked green in the figure) was given.

Figure 1. Letter of inquiry.Note: English translation of the two original letters of inquiry in Swedish sent from the fictitious couples to the public housing companies. The first version of the letter was used for all inquiries on January 18, 2022, and the second version was used for all inquiries on April 2, 2022. The names of the couples (marked red in the figure) were randomly assigned in the first stage of mailing and alternated in the second stage. In the second version of the letter, the actual name of a municipality (marked green in the figure) was given.

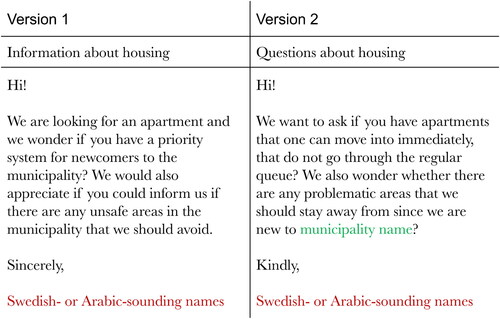
Table 1. Definitions of variables.

Figure 2. Fraction of inquiries that led to a positive outcome for each couple.

Note: Blue lines are 95% CI. № of firms = 271. Each firm received two inquiries, one from each couple. Red dots represent the probability of receiving an email reply (A), personal greeting (B), information about priority system for newcomers (C), and information about bad neighborhoods (D). Definitions of all variables are provided in .

Figure 2. Fraction of inquiries that led to a positive outcome for each couple.Note: Blue lines are 95% CI. № of firms = 271. Each firm received two inquiries, one from each couple. Red dots represent the probability of receiving an email reply (A), personal greeting (B), information about priority system for newcomers (C), and information about bad neighborhoods (D). Definitions of all variables are provided in Table 1.

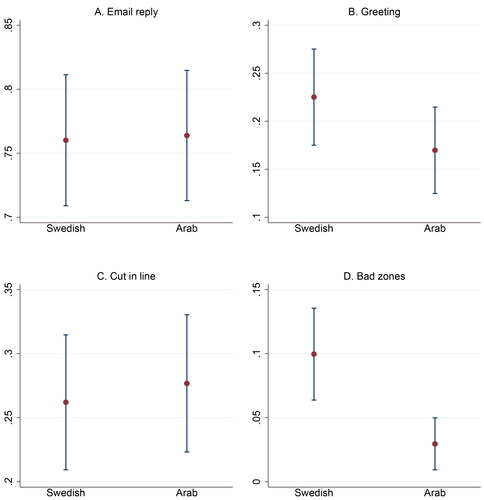
Table 2. Distribution of public housing companies’ responses to housing inquirers.

Table 3. Positive outcome probabilities, adjusted for county and order effects.