Figures & data
Table 1. Characteristics of the respondents in the study.
Figure 1. Percentage distribution of the sample by engagement in type of extra-curricular activity and sex.
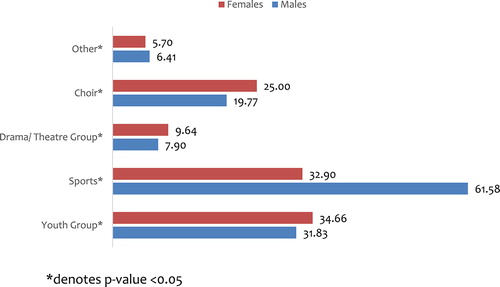
Table 2. Percentage distribution and rates of risky behaviours by type and sex of youth.
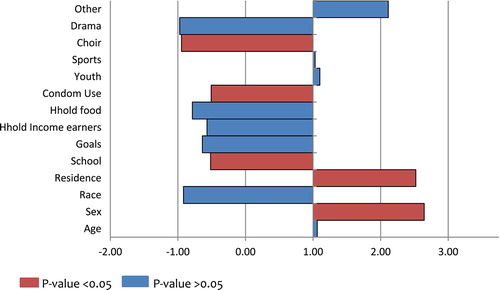
Figure 2. Adjusted odds ratios (OR) of risky sexual behaviour by characteristics of adolescents in South Africa.
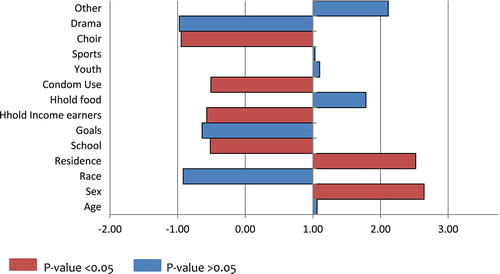
Figure 3. Adjusted odds ratios (OR) of illicit drug use by characteristics of adolescents in South Africa.