
Figures & data
Table 1. Frequencies and percentages for demographic characteristics of samples
Figure 1. The locations of sample schools in Taiwan
*Map was retrieved from google maps (https://www.google.com/maps) on 27 September 2018.
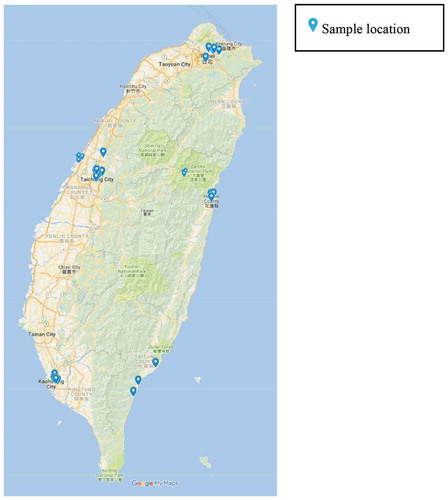
Table 2. Obliquely rotated component loadings for 19 survey items
Table 3. Means, standard deviations, and inter-correlations of factors and variables
Figure 2. Levels of network structure
*Network data were from one of class samples in this study.
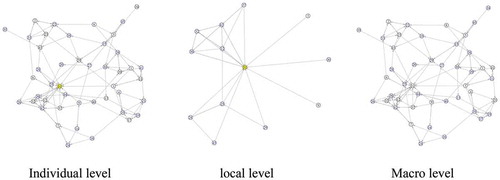
Table 4. Effects of network features on individual’s community attachment