
Figures & data
Figure 1. GDP per capita growth (annual %).
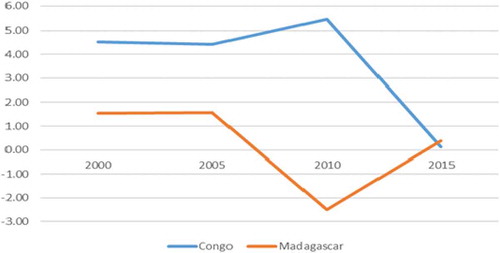
Figure 2. Value add (% GDP) per sector.
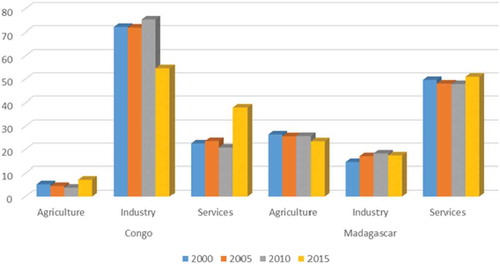
Figure 3. Trade (%GDP).
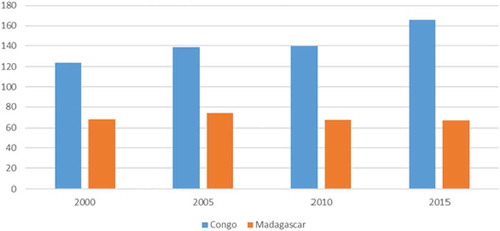
Figure 4. Annual Population Growth (%).
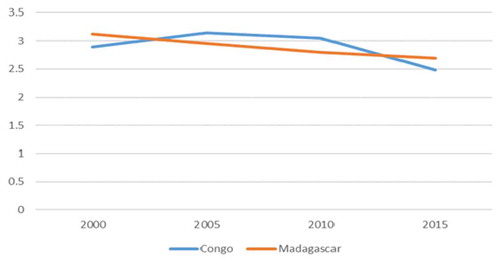
Figure 5. Unemployment, youth (% of labour force ages 15–24), by gender.
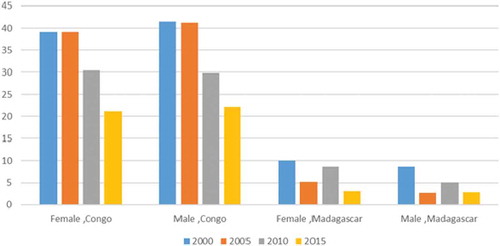
Figure 6. Wage and salaried workers, (% of employment), by gender.

Figure 7. Labour force participation rate for ages 15–24, total (%).
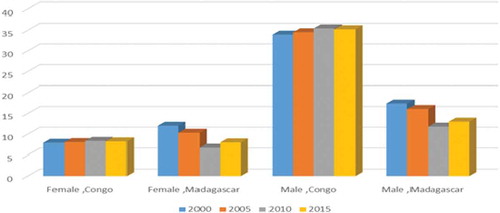
Table 1. Distribution of youth by sex, by area of residence and unemployment.
Table 2. Youth education status.
Table 3. Highest qualification among youth who were not attending school or training, Congo.
Table 4. Highest qualification among youth who were not attending school or training, Madagascar.
Table 5. Youth left school before completion by reasons.
Table 6. Youth perspective for future job.
Table 7. Employment status among workers youth.
Table 8. Fringe benefits young workers could get access to.
Figure 8. Wage employees by type of contact (% of wage employees).
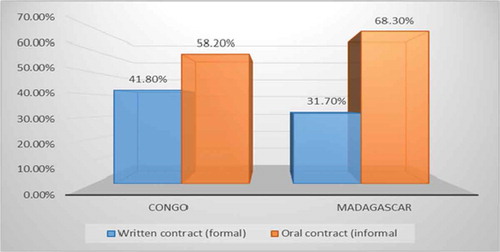
Table 9. Employment status by Educational attainment, Congo.
Table 10. Employment status by Educational attainment, Madagascar.
Table 11. Wages Workers by type of contract and educational attainment, Congo.
Table 12. Wages Workers by type of contract and educational attainment, Madagascar.
Table 13. Wage Regression, Dependent variable log Wage.
Table A1. Unemployment, youth total (% of total labour force ages 15–24), Selected African countries, 2005–2019.