
Figures & data
Figure 1. Average profile of an “ideal” mindchanger (a) and young respondents’ self-perceptions (b).
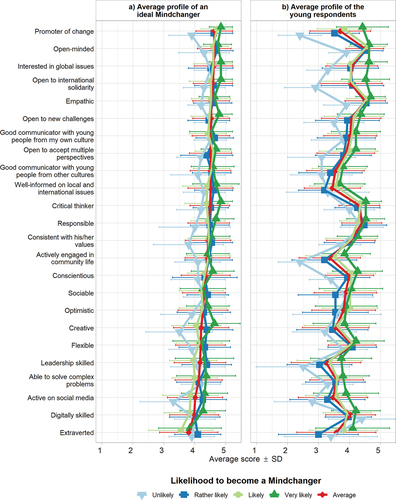
Table 1. Characteristics of the ‘ideal’ mindchanger with statistically significant differences in the likelihood to become a mindchanger (Kruskal-Wallis test results).
Figure 2. Profile of respondents in their likelihood to become a mindchanger versus the “ideal” profile of a mindchanger.
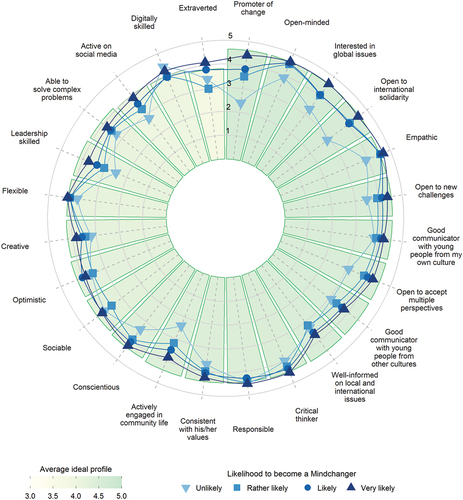
Table 2. Characteristics of the young respondents with statistically significant differences in the likelihood to become a mindchanger (Kruskal-Wallis test results).
Figure 3. Mean score and 95% confidence interval (CI) for characteristics with statistically significant differences by gender (a) and place of residence (b).
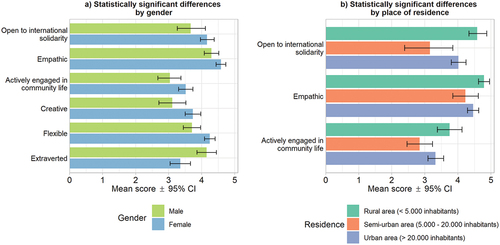
Table 3. Characteristics of the young respondents with statistically significant differences by gender (Mann-whitney U test) and place of residence (Kruskal-Wallis test).