Figures & data
Table 1. Constructs and observable variables under study.
Figure 1. Relationship between frequency of Internet/social media use and gender.
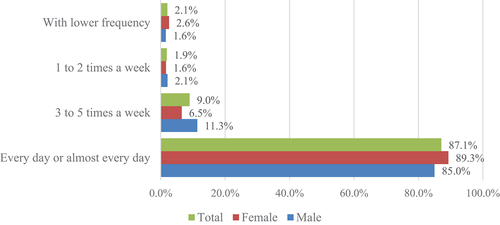
Table 2. Association between gender and other socio-demographic factors and frequency of social media and Internet use.
Figure 2. Relationship between young people’s daily use of social media and gender.
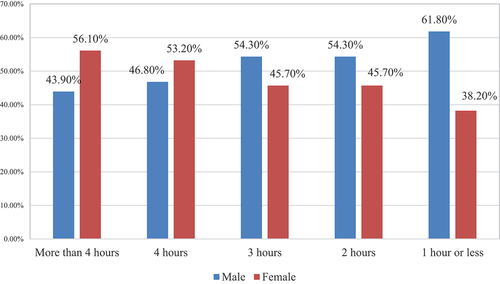
Table 3. Association between the other socio-demographic factors and daily time spent on social media.
Figure 3. Activities carried out in the online environment.
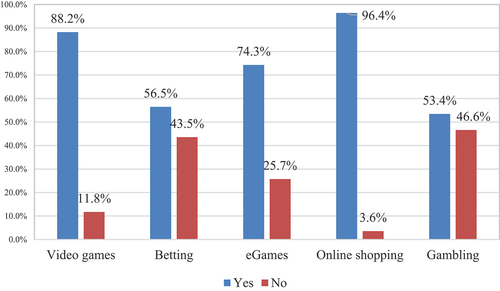
Table 4. Relationship between the activities carried out in the online environment by young people and their socio-demographic characteristics.
Table 5. Association between participation in betting and gambling and age groups.
Figure 4. Distribution of emotions in young people’s online environment according to gender.
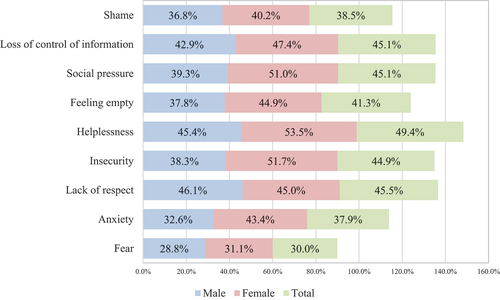
Figure 5. Distribution of emotions in young people’s online environment according to age.
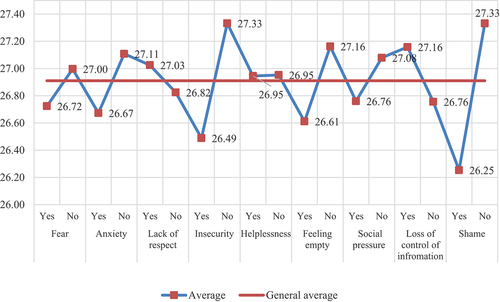
Table 6. Relationship between activities performed and negative emotions in the online environment for young people.
Figure 6. Perception of risk in activities by age of young people.
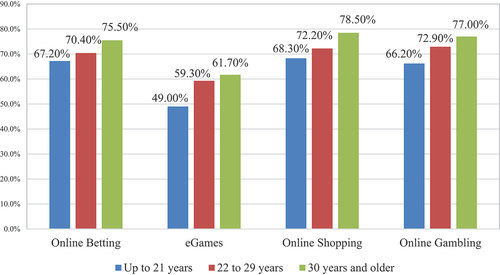
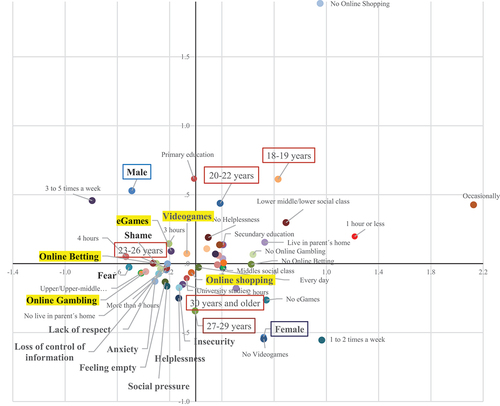
Figure 7. Map of the simultaneous relationships between the demographic characteristics of young people, usage habits, activities performed and emotions experienced in the online environment.