Figures & data
Table 1. Descriptive statistics.
Table 2. Comparisons between the study groups.
Table 3. Performance of logistic regression models predicting sexual abuse.
Figure 1. Decision tree for predicting sexual abuse (1), candidate predictors are MSDQ and drawing indicator scores.
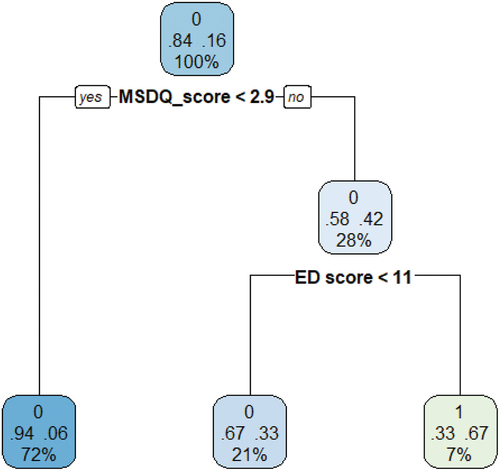
Figure 2. Decision tree for predicting sexual abuse (1), candidate predictors are drawing indicator scores.
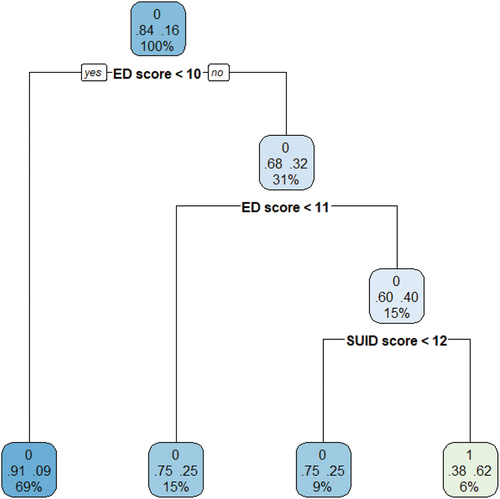
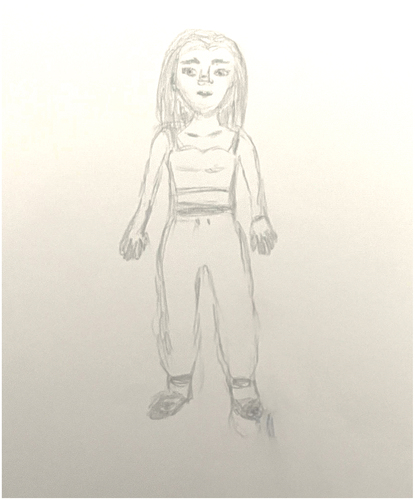
Figure 3. Female aged 14, diagnosed with eating disorders, three indicators of ED (shaded mouth, doubly emphasized neck, no feet), 4 indicators of CSA (shaded eyes, doubled cheek, shaded arms, and hands, emphasized shaded lower body- genitals).

Figure 4. Female aged 15, hospitalized after attempted suicide three indicators of suicidality (shaded face/head, shaded feet, X on mouth), and 4 indicators of CSA (no eyes, no hands, doubled chin, belt/emphasized boundary between upper and lower body).

Figure 5. Healthy female aged 14 (controls), no indicators of CSA, ED, or suicidality.