
Figures & data
Figure 1. shows the sample distribution by gender.
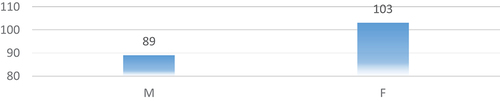
Figure 2. shows sample distribution by age.
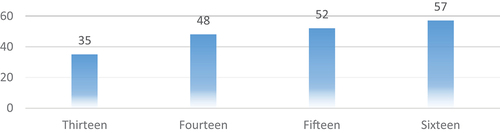
Figure 3. shows sample distribution by specialization.
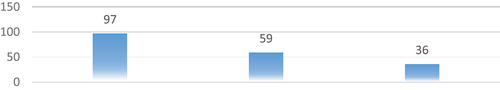
Figure 4. shows ample distribution by the favourite means of communication.
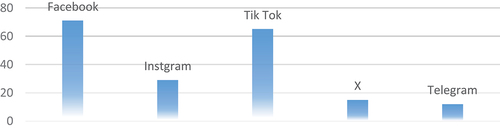
Table 1. Shows the sample characteristics regarding gender, specialization, favourite communications, living place, and nationalities.
Table 2. shows the correlation coefficients between the score of each statement and the total score of the questionnaire on digital life quality.
Table 3. shows the extent of adolescents’ use of social media.
Table 4. shows the impact of using social media on the respondents’ digital life quality.
Table 5. shows the test of differences between respondents in their use of social media by gender.
Table 6. shows the ANOVA test of differences between respondents in their use of social media by age, specialization, and favourite means of communication.