Figures & data
Figure 1. The transition temperatures and melting points (°C) for sexiphenyl, 1, quinquephenyl, 2, and 2′, 3″′′-dimethylsexiphenyl 3.
Figure 2. The twisted structure of dimethylsexiphenyl producing a better steric fit of the molecules together in a lock and key arrangement as predicted by Subramaniam and Gilpin. The black discs represent the methyl groups.
Table 1. The packing fractions (Pf) for the undecyloxy and dodecyloxy cyanobiphenyls (nOCBs) for the SmA phase to the liquid and the SmA to the solid.
Figure 3. Comparisons between the clearing point N to I transition temperatures (°C) for the 4-alkyl-4″-cyano-p-terphenyls (propyl and heptyl, top), and the 4-alkyl-2′-methyl-4″-cyano-p-terphenyls (propyl and heptyl, bottom).
Figure 4. Possibilities for rod-like design in calamitic systems (left), and positions for filling in space with substituents; terminal (top), lateral (bottom).
Table 2. Transition temperatures (°C) for terminally substituted cyanobiphenyls with tert-butyl or trimethylsilyl units, with those of 4-undecyloxy-4′-cyanobiphenyl (11OCB) for comparison.[Citation20]
Figure 5. The structure of the bilayer SmA phase stabilised by quadrupolar interactions (left), and the structure of the SmA phase with the molecules possessing terminal substituents that are squeezed into the layer interface to give so-called ‘microphase segregation’ (right).
Table 3. Transition temperatures (°C) for terminally substituted cyanobiphenyls with halogens or hydroxyl units, with those of 4-alkoxy-4′-cyanobiphenyl (nOCBs) for comparison [Citation22,Citation23].
Table 4. Transition temperatures (°C) for terminally substituted cyanobiphenyls with glucopyranoside units [Citation22].
Figure 6. Schematic representation of the packing of molecules with a gross zigzag shape into a phase type in which the molecules are tilted with respect to the layer normal.
Figure 7. Space filling and reduction in free space in the Wulf model of the SmC phase.
Table 5. The molecular structures and transition temperatures (°C) of the series of esters reported by Goodby et al. [Citation31].
Table 6. Transition temperatures (°C) for substituted 4-(4′-alkoxy-2′,3′-difluorobiphenyl) benzoates.[Citation37]
Figure 8. Structure (b) supports the higher SmC to N transition temperature, structure (c) is less likely to support tilted phase formation and structure (a) is the parent system.
Figure 9. The bent and twisted molecular architectures of zigzag-shaped molecules.
Figure 10. The synclinic and anticlinic packing arrangements in tilted mesophases.
Figure 11. Layer rotation in the synclinic phase of molecules with bent and twisted molecular architectures.
Figure 12. The anticlinic helical organisation of molecules with bent-twisted shapes.
Figure 13. The synclinic and anticlinic structures for the phases of bent core materials.
Figure 14. (colour online) The molecular structures of 1,ω-di-(1″-cyanobiphenyl-4-yl)alkanes (CBnCBs) (top) and a minimised structure of CB11CB showing its bent molecular architecture (bottom).
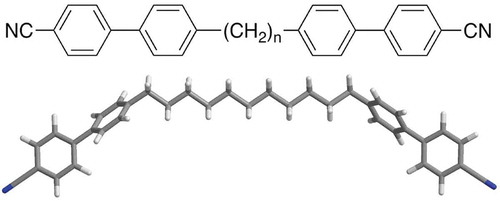
Figure 15. The alternating intercalating packing arrangement of a dimesogen 1,ω-di-(1′-cyanobiphenyl-4-yl)undecane (CB11CB) with odd parity. Reproduced with permission of the Royal Society of Chemistry from Mandle et al.[Citation46]
![Figure 15. The alternating intercalating packing arrangement of a dimesogen 1,ω-di-(1′-cyanobiphenyl-4-yl)undecane (CB11CB) with odd parity. Reproduced with permission of the Royal Society of Chemistry from Mandle et al.[Citation46]](/cms/asset/f9b3f471-1e4f-43fb-81a3-223ecb1ce058/tlct_a_1030348_f0015_b.gif)
Figure 16. Some material types found to exhibit the NTB phase. Polar systems, apolar systems (this work) and mixed ether/ester-linked systems [Citation46–Citation48]. Reproduced with permission of the Royal Society of Chemistry from Mandle et al. [Citation47]
![Figure 16. Some material types found to exhibit the NTB phase. Polar systems, apolar systems (this work) and mixed ether/ester-linked systems [Citation46–Citation48]. Reproduced with permission of the Royal Society of Chemistry from Mandle et al. [Citation47]](/cms/asset/ff71a0b3-f732-45d2-88b1-90228a3617cf/tlct_a_1030348_f0016_b.gif)
Figure 17. 1,2-Dioleoyl-sn-glycero-3-phosphocholine (DOPC).
Figure 18. The texture of the helical structure of 1,2-dioleoyl-sn-glycero-3-phosphocholine (DOPC) (×100).
Figure 19. Proposed hexagonal packing arrangement of the NTB ‘supramolecular’ fibres.
Figure 20. Helical fibres packing together to give a superstructure with long pitch.
Figure 21. Structure of the TGB phase. [Citation58] Copyright Wiley-VCH Verlag GmbH & Co. KGaA reproduced with permission.
![Figure 21. Structure of the TGB phase. [Citation58] Copyright Wiley-VCH Verlag GmbH & Co. KGaA reproduced with permission.](/cms/asset/544aef19-c010-4765-b97d-457a1776eb00/tlct_a_1030348_f0021_b.gif)
Figure 22. A nanoparticle substituted by aliphatic chains in the gas phase.
Figure 23. Dendritic materials with increasing mesogenic units from left to right, and the phases that they support.
Figure 24. Effect of numbers of mesogens on transition temperatures (°C) for a series of laterally appended supermolecules [Citation59–Citation61]. Reproduced with kind permission from Springer Science and Business Media.
![Figure 24. Effect of numbers of mesogens on transition temperatures (°C) for a series of laterally appended supermolecules [Citation59–Citation61]. Reproduced with kind permission from Springer Science and Business Media.](/cms/asset/73b0b0f0-9760-4544-b35b-ae56467b1efc/tlct_a_1030348_f0024_b.gif)
Figure 25. Transition temperatures (°C) for the tetramers of alkyloxy-cyanobiphenyls substituted tetrakis-(dimethylsiloxy)silanes.
Figure 26. The molecular shape of tetramer with a C11 spacer unit shows the minimised structure in the gas phase at absolute zero using a Silicon Graphics system operating with Quanta and CHARMm software.
Figure 27. The structure of the lamellar phase of the alkyloxy-cyanobiphenyls substituted tetrakis-(dimethylsiloxy)silanes.
Table 7. Transition temperatures (°C) for the tetramers of alkyloxy-cyanobiphenyl substituted tetrakis-(dimethylsiloxy)silanes.
Figure 28. Gold nanoparticles of ~3 nm in diameter coated with ω-n-(4-cyanobiphenyl-4′-yloxy)octylthiol ligands: (a) a sketch of the bonds, (b) a space-filling model for ligands in the gas phase at 0 K, (c) bunching of the ligands at the poles of the nanoparticle. Reproduced with permission from Draper et al. [Citation71]. Copyright Wiley-VCH Verlag GmbH & Co. KGaA.
![Figure 28. Gold nanoparticles of ~3 nm in diameter coated with ω-n-(4-cyanobiphenyl-4′-yloxy)octylthiol ligands: (a) a sketch of the bonds, (b) a space-filling model for ligands in the gas phase at 0 K, (c) bunching of the ligands at the poles of the nanoparticle. Reproduced with permission from Draper et al. [Citation71]. Copyright Wiley-VCH Verlag GmbH & Co. KGaA.](/cms/asset/0ca3cabb-62ce-465e-a204-5fd878cc69b6/tlct_a_1030348_f0028_b.gif)
Figure 29. Surfactants used as ligands for quantum dots. Reproduced with permission from Prodanov et al. [Citation76]. Copyright 2013 American Chemical Society.
![Figure 29. Surfactants used as ligands for quantum dots. Reproduced with permission from Prodanov et al. [Citation76]. Copyright 2013 American Chemical Society.](/cms/asset/3ae65f31-97a6-4b90-91d2-8a5e0f9677f0/tlct_a_1030348_f0029_b.gif)
Figure 30. Schematic of mixed surfactants in their proportions used as ligands attached to quantum dots (quarter circle).
Figure 31. A liquid crystal host and coated nanoparticle colloidal system. (Left) The surfactant shell is composed of mesogen dendrons; (right) the surfactant shell is a mixture of mesogenic dendrons and aliphatic chains.
Figure 32. Hexagonal arrangement of aliphatic substituted aromatic disc that forms the basis of the structure of columnar liquid crystals.
Figure 33. The columnar structure of disordered and ordered hexagonal phases.
Figure 34. (Left) The dendritic texture of the disordered hexagonal columnar phase growing on cooling from the isotropic liquid (×100); (right) the dendritic texture of the crystal B phase (×100).
Figure 35. The binary phase diagram as a function of temperature (°C) and concentration (mol%) for two benzoate esters of hexahydroxytriphenylene.
Figure 36. A disordered hexagonal columnar phase made up of molecules of different diameters, which are laterally and vertically disorganised along the column axes. The defects between the columns, shown by the heavy lines, will possess long-range periodic ordering.
Figure 37. Star-like molecules conformationally change to form columns where the arms of the molecules become almost parallel to the axes of the columns.
Figure 38. The relationship between condensed phase structures and crystallinic ordering.
Figure 39. The phase behaviour of 3′-nitro-4′-hexadecyloxybiphenyl-4-carboxylic acid [Citation63].
![Figure 39. The phase behaviour of 3′-nitro-4′-hexadecyloxybiphenyl-4-carboxylic acid [Citation63].](/cms/asset/ba70ac03-978b-4f86-b14a-5be6a0b8ef21/tlct_a_1030348_f0039_b.gif)
Figure 40. Phase behaviour and transition temperatures (°C) for a glycosteroid.
Figure 41. (a) The schlieren texture of the nematic phase; (b) the formation of droplets of the chiral nematic phase as it forms from the isotropic liquid; (c) the growth of cubic structures in the liquid for the formation of the blue phase; and (d) the stepped texture of the twist bend phase, where the steps are associated with the correlation length (all ×100).
Figure 42. Molecular ordering in the smectic state of matter showing the stepwise breakdown in order progressing from the solid to the liquid.
Figure 43. (colour online) Relationships between mesophase types, length scales and anisotropy when the free volume is minimised.
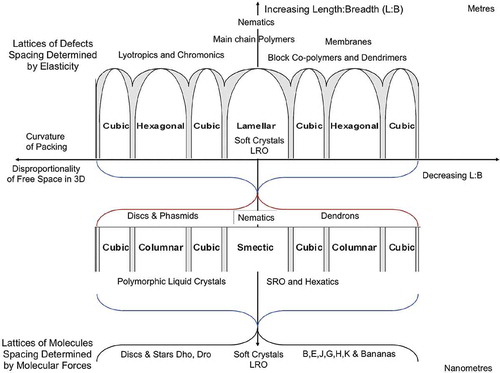
Figure 44. A cubic phase occurring below a SmC phase on cooling.
Figure 45. Shaken jelly worm sweets.