Figures & data
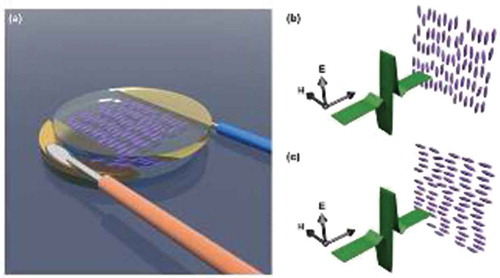
Figure 1. (colour online) (a) Schematic illustration of fabricated LCs cell for THz-TDS measurement. (b, c) The extraordinary and ordinary configurations, respectively.

Figure 2. (colour online) Refractive index (a) and absorption coefficient (b) of E7 at different voltages.
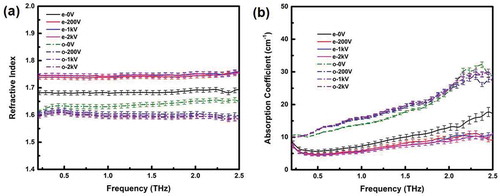
Figure 3. (colour online) Refractive index (a) and absorption coefficient (b) of BL037 at different voltages.
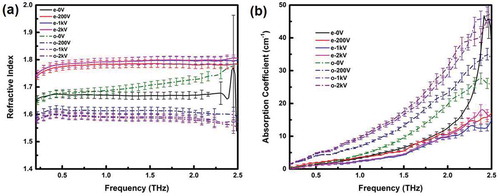
Figure 4. (colour online) Refractive index (a) and absorption coefficient (b) of MDA-98-1602 at different voltages.
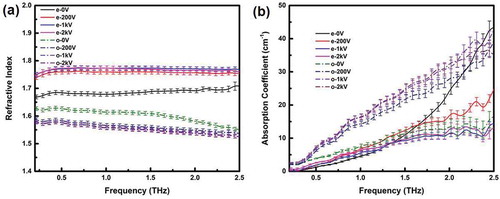
Figure 5. (colour online) Refractive index (a) and absorption coefficient (b) of LCMS-107 at different voltages.
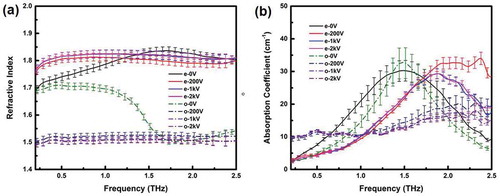
Figure 6. (colour online) Refractive index (a) and absorption coefficient (b) of 1825 at different voltages.
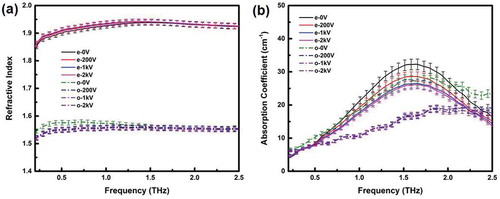
Figure 7. (colour online) Refractive index (a) and absorption coefficient (b) of GT3-23001 at different voltages.
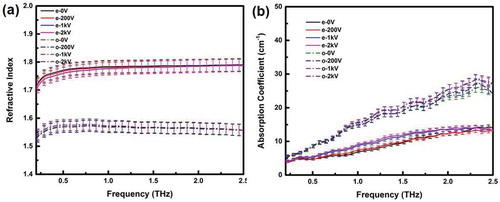
Figure 8. (colour online) Comparison of refractive indices (a) and absorption coefficient (b) of different nematic LC materials in THz range. The legend in the refractive index (left) is the same as that in absorption coefficient graph (right).
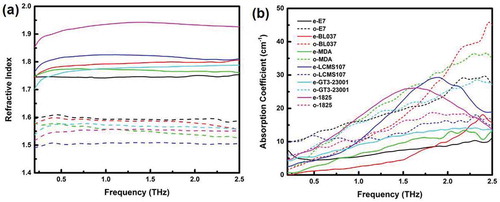
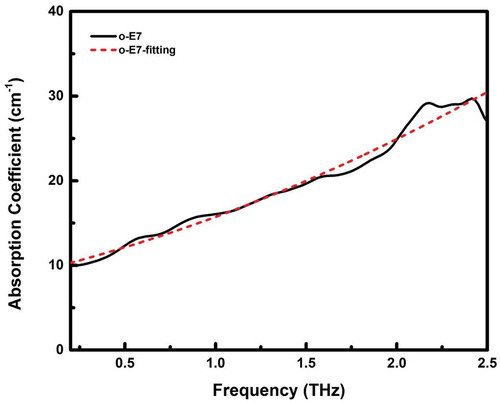
Figure 9. (colour online) Calculated absorption spectrum of E7 ordinary state. The dotted line indicates a Gaussian fit.