
Figures & data
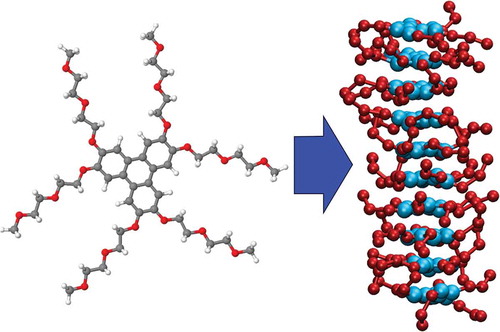
Figure 1. (Colour online) (a) Molecular structure of the chromonic liquid crystal, TP6EO2M. (b) Coarse-grained mapping used in this work, showing four bead types: CC – pink, CO – orange, AI – blue, AO – green.
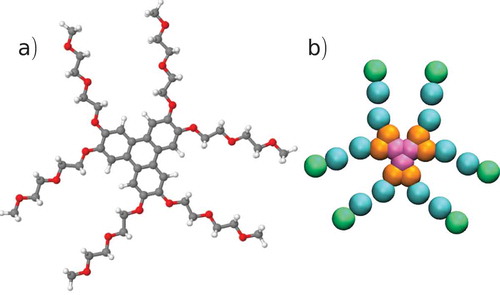
Table 1. MARTINI nonbonded parameters used in this study.
Table 2. MARTINI angle parameters used in this study.
Table 3. MARTINI bond parameters used in this study.
Table 4. MARTINI improper dihedral parameters used in this study.
Table 5. SAFT nonbonded parameters used in this study.
Figure 2. (Colour online) A series of snapshots taken from the simulation of the MARTINI model of TP6EO2M in water at 280 K, showing the central aromatic core of molecules, taken at (a) the start of the simulation, (b) 50 ns and (c) 90 ns. The simulation trajectory shows the spontaneous self-assembly of short chromonic stacks.
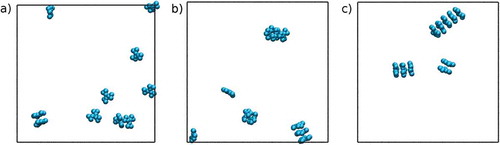
Figure 3. (Colour online) Probability distributions for the pair distances, , and
for a single chromonic stack simulated at 280 K using the MARTINI model for TP6EO2M.
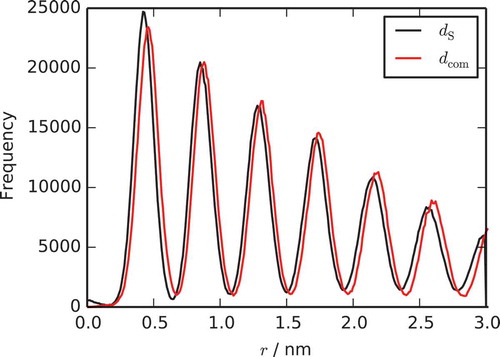
Figure 4. (Colour online) Potential of mean force curves calculated for the separation of a dimer of two molecules for the MARTINI model and the SAFT-γ model.
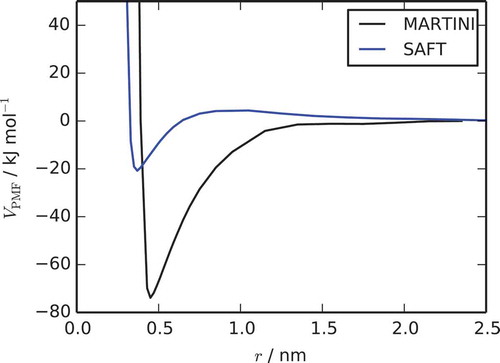
Figure 5. (Colour online) The influence of unfavourable cross-interactions on chromonic stacking. Up arrows indicate interactions that are less favourable than mixing rules with . Equal signs indicate
. Chromonic stacks are found when aromatic group interactions with both ethylene oxide and water are unfavourable, apart from when ethylene oxide and water interactions are also unfavourable.
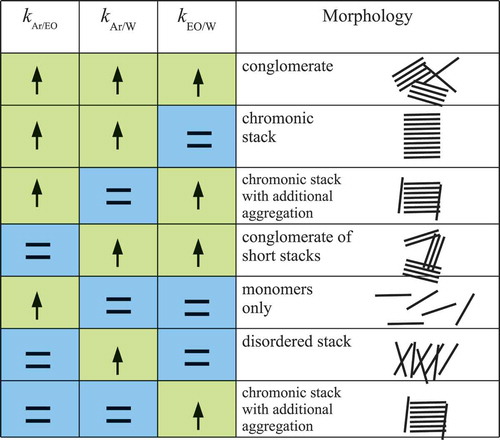
Figure 6. (Colour online) Simulation snapshot of a dimer using the original SAFT model with unadjusted bond lengths, with the core–core distance constrained at 0.55 nm. Only the aromatic cores are shown.
