
Figures & data
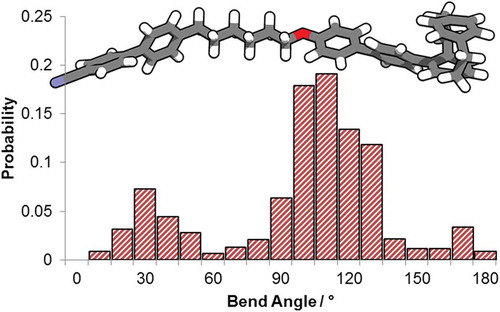
Figure 1. The DFT(B3LYP/6-311G(dp)) optimised geometry of both the S (left) and R (right) forms of 4-fluoro[2,2]paracyclophane.
![Figure 1. The DFT(B3LYP/6-311G(dp)) optimised geometry of both the S (left) and R (right) forms of 4-fluoro[2,2]paracyclophane.](/cms/asset/831b4b5e-e0d1-4cdd-8c49-4897ab4071a1/tlct_a_1453559_f0001_oc.jpg)
Figure 2. Plot of the reciprocal pitch (1/P, μm−1) as a function of concentration (wt %) for binary mixtures of 1 in 5CB.
Figure 3. The molecular structures of compound 2 (Cr 138.3 Iso) and the related dimer CB6OCB (Cr 102 TB 110.5 N 154.2 Iso. Liq.) [Citation15,Citation17].
![Figure 3. The molecular structures of compound 2 (Cr 138.3 Iso) and the related dimer CB6OCB (Cr 102 TB 110.5 N 154.2 Iso. Liq.) [Citation15,Citation17].](/cms/asset/2932c6a8-afc6-446a-af07-30b928f06509/tlct_a_1453559_f0003_b.gif)
Table 1. Transition temperatures (°C) and pitch lengths (PN*, μm) for mixtures A – I and extrapolated values (*) for compound 1. Measurements were performed at 20°C for all materials which correspond to the reduced temperatures (Tr, TN-Iso/T) indicated.
Table 2. Transition temperatures (°C), associated enthalpies of transition [kJ mol−1] and pitch lengths (PN*, μm) for mixtures A – F and extrapolated values (*) for compound 2. # The pitch of mixture A was too long (>100 μm) to be measured by the Cano Wedge method. Measurements were performed at 20°C for all materials which corresponds to the reduced temperatures (Tr, TN-Iso/T) indicated.
Figure 4. Plot of the reciprocal pitch (1/P, μm−1) as a function of concentration (wt %) for binary mixtures of 2 in 5CB.
Figure 5. Plot of the energy relative to the lowest conformer (kJ mol−1) as a function of the indicated torsional angle (τ, °) for p-terphenyl (a) and (R) 4-biphenyl-[2,2]-paracyclophane (b) as calculated at the wB97XD/6-31G(d,p) level of DFT. Spline fits (solid lines) are presented as a guide to the eye.
![Figure 5. Plot of the energy relative to the lowest conformer (kJ mol−1) as a function of the indicated torsional angle (τ, °) for p-terphenyl (a) and (R) 4-biphenyl-[2,2]-paracyclophane (b) as calculated at the wB97XD/6-31G(d,p) level of DFT. Spline fits (solid lines) are presented as a guide to the eye.](/cms/asset/febd9827-bb12-464f-9c71-0328b904ea79/tlct_a_1453559_f0005_oc.jpg)
Figure 6. (A) The wB97XD/6-31G(d,p) minimised geometry of compound 2; (B) histogram plot of the probability of a given bend angle – defined as the angle between the long axis of each mesogenic unit – for CB6OCB and compound 2 determined using the AM1 semi empirical method as described in ref [Citation15].
![Figure 6. (A) The wB97XD/6-31G(d,p) minimised geometry of compound 2; (B) histogram plot of the probability of a given bend angle – defined as the angle between the long axis of each mesogenic unit – for CB6OCB and compound 2 determined using the AM1 semi empirical method as described in ref [Citation15].](/cms/asset/427552f4-ca13-44ef-82a4-8580e3d55655/tlct_a_1453559_f0006_oc.jpg)
Figure 7. A hypothetical [2,2] paracyclophane in which both rings are incorporated into the mesogenic unit. When three of the four R groups are different the resulting material is chiral.
![Figure 7. A hypothetical [2,2] paracyclophane in which both rings are incorporated into the mesogenic unit. When three of the four R groups are different the resulting material is chiral.](/cms/asset/64997fcd-d852-4fe8-986f-2ee70885be46/tlct_a_1453559_f0007_b.gif)